Quantcast
Channel: AI Features - Latest Features & Products in Artificial Intelligence
Viewing all 435 articles
Browse latest View live

Top 10 Analytics Trends in India – 2014

$
0
0

top 10 trends

Now that 2014 is coming to an end, we thought it’s a good time to understand where we are in the whole analytics journey and what to expect in future. We surveyed analytics leaders in India to get their thoughts on some of the key trends in analytics and Data science.

Below we have compiled the top 10 most relevant analytics trend for the year.

Innovative service models

Indian service story till now has mostly been that of scale. We have successfully deployed some the biggest IT and BPO projects in the history. Yet, with analytics, the same service models may not be the best bet for India’s success in this new industry.

Pavan Bagai, President and COO, EXL says, ” Successful analytics service provider operating models and relationships with clients will begin to resemble the Japanese Keiretsus rather than traditional arms-length outsourced relationships: For analytics to be successfully outsourced to a service provider, the relationship can’t be transactional or rule-based.

The provider teams must feel like remote extensions of onsite internal teams and must be treated as such. Only then will clients extract the true value out of analytics service providers in a sustained fashion. Without this operating model, jaded and disenchanted clients will leave a lot of value on the table or abandon their analytics initiatives altogether.”

Rise of analytics product comapnies

Indian service story was also frowned by many as not innovating many products out of India. This seems to be changing with analytics.

According to Suresh V Shankar, Founder, Crayon Data says – “Service companies are the past, Product companies the future.”


Akash Bhatia_profile_pic
Akash Bhatia, Co-founder & CEO at Infinite Analytics, says “The ability to link and merge all massive data sets and to provide actionable insights along with the action into a product, rather than a service, is going to be the most important trend emerging in the analytics space.”

Integration of analytics in Strategy consulting

Pavan BagaiPavan Bagai, President and COO, EXL says, “Tradition strategy consulting firms will try and provide analytics (or analytics driven) services: Clients have decreasing budgets for strategy but larger budgets for data and analytics engagements. So strategy companies – either through acquisition, partnerships or home-builds – will aim to offer analytics to their clients.”

Retail in India is becoming more analytics savvy

Gaurav Vohra, CEO at Jigsaw Academy, says – “Retail is undergoing major upheaval in India. With more and more brick and mortar retailers putting their resources in the virtual space to compete with e-tailers, the boundary between real and virtual is fast disappearing. As a result, the retail sector is becoming tremendously competitive. We are seeing retailers (online and brick and mortar) investing heavily in talent and technology for advanced analytics. Retail in india is becoming very analytics savvy.”

Collaborative talent development

Pavan Bagai, President and COO, EXL says, “Analytics talent development will become collaborative – increasingly leading providers will partner with educational institutions to create analytics training programs that are more aligned with the required skill sets. This will have a dramatic impact as it will expand the career options for most students. This will be critical for India to maintain its positioning as an Analytics powerhouse.”

6.Location Analytics

ritesh quanttaRitesh Bawri, Founder, Quantta Analytics says, “As it becomes increasingly possible to connect technology to the exact location of a person on a desktop or mobile, solutions will emerge that will leverage this knowledge to provide solution that are context aware or understand where you are in the physical world to provide you solution that suit your immediate need.”

7. Smart Machines

Ruban.JPG[4]Ruban Phukan, Co-Founder & Chief Product Officer at DataRPM, says “The next huge revolution that is coming to the industry of analytics is the emergence of Smart Machines. We have already seen smart machines making the world better in consumer tech like Siri in iPhone, Google Now and others. Now smart machines are poised to revolutionize the enterprise tech world with IBM Watson already making big waves in healthcare knowledge discovery and startups like DataRPM in enterprise data discovery.”

According to Lavanya Uppala, Practice Head, Data Analytics, Robert Bosch Engineering – “Holistically analysing sensor data from various sources will be the backbone for smart living”.

Ritesh Bawri, Founder, Quantta Analytics says, “Technology will migrate from the computer to becoming an integral part of everything physical. All physical products – your car, your house, the street lights your phone will talk to each other to provide a superior world for human beings.

8.Open Source

Gaurav Vohra, CEO at Jigsaw Academy says “We are seeing that increasingly companies are looking for skills such as R, Python, hadoop and other open source technologies.”

9. Hadoop and other big data tools

puneet brillioHadoop to continue growing but viable alternatives will begin to surface.

Puneet Gupta, CTO at Brillio, says – “On the analytics & big data technology side, credible alternatives for big data processing on cloud will begin to gain acceptance, with Google BigQuery, IBM Bluemix & Amazon Kinesis likely to gain more traction.”

10. Gujarat is becoming a centre for analytics

short-course-gaurav-vohraGaurav Vohra, CEO at Jigsaw Academy says “We are seeing a lot of demand for trained data scientists from companies based out of cities such as Ahmedabad, Surat, Baroda etc.”

(Visited 2,723 times, 121 visits today)

The post Top 10 Analytics Trends in India – 2014 appeared first on Analytics India Magazine.


Poll: Which Analytics Event would you like to Attend?

Web Analytics in India – A Study by AnalyticsPeepal

$
0
0

Web analytics is a generic term meaning the study of the impact of a website on its users. Ecommerce companies and other website publishers often use Web analytics software to measure such concrete details as how many people visited their site, how many of those visitors were unique visitors, how they came to the site (i.e., if they followed a link to get to the site or came there directly), what keywords they searched with on the site's search engine, how long they stayed on a given page or on the entire site and what links they clicked on and when they left the site.

Web analytic software can also be used to monitor whether or not a site's pages are working properly. With this information, Web site administrators can determine which areas of the site are popular and which areas of the site do not get traffic. Web analytics provides these site administrators and publishers with data that can be used to streamline a website to create a better user experience.

A lot of Indian companies are using the web more effectively now. The last three years have seen an online boom in India with thousands of online companies mushrooming all over the country. There will be a huge increase in demand for web analytics as these companies fight to become more competitive.

We will see an increase in demand for web analytics, whose salaries are predicted to be 20% higher than IT professionals with similar years of experience.

apeepal

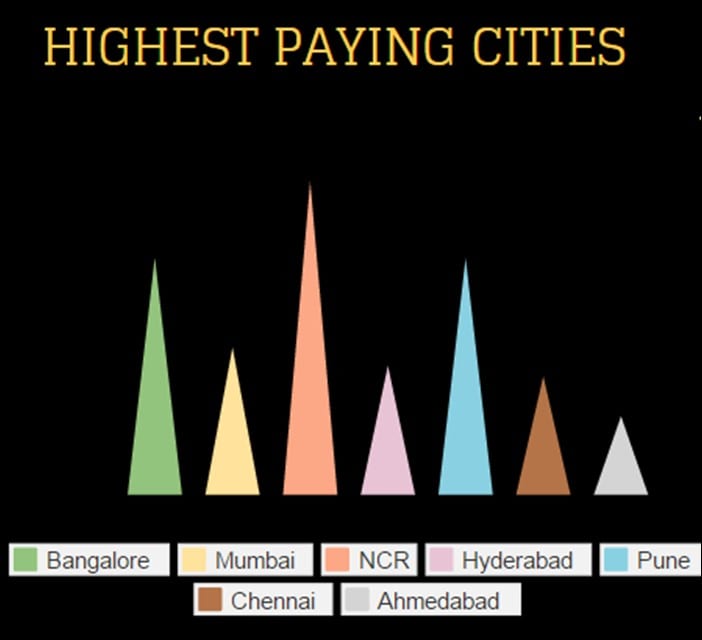
Bangalore and NCR offers high salary packages for web analytics. Gurgaon alone shares 24.86% of the total salary, followed by Pune and Bangalore, with 18.75% and 18.9% respectively.

apeepal2

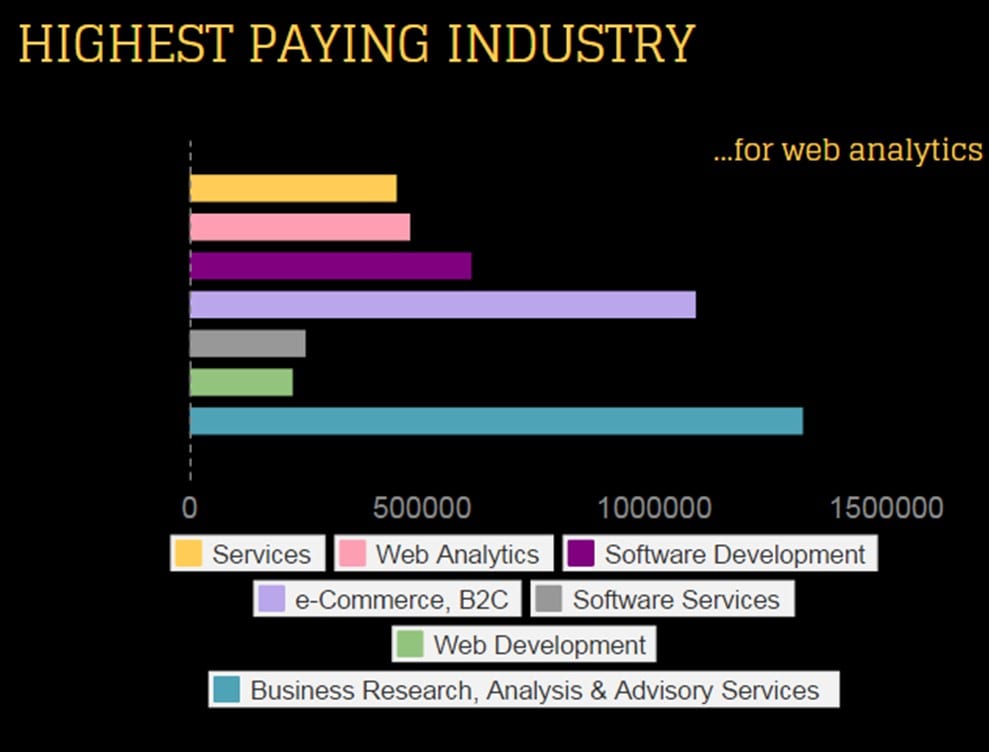
The highest paying industry for web analytics is Business Research, Analysis and Advisory Services, followed by the ecommerce domain and software development.


Data shows that in start ups, the top management level (10-15 years experience), data and web analytics is the hottest skill. The top skills in demand are Google Analytics, Site Catalysts, Web Trends, UnicaNetInsight, UnicaNetTracker, Coremetrics, Omniture and ClickTracks.

With the growth in internet data access across the world we have see huge data growth across many categories. This has created and will continue to create specialized careers in the web analytics domain over the next five years – Sofware Development, ecommerce, Healthcare, Digital Advertising, Lifestyle etc. The report above shows the study done through Secondary sources, on the changes in Web Analytics hiring. What do you make of these trends? Share your perspectives with us. If you want to talk about your requirements or learn about hiring trends in general, you can write to Kaveri.Karnam@analyticspeepal.com or talk to me on +91 9945444884.

(Visited 140 times, 2 visits today)

The post Web Analytics in India – A Study by AnalyticsPeepal appeared first on Analytics India Magazine.

Analytics trends 2014 – Place your bets

$
0
0

peepal-office

Over the decade, India has certainly evolved as a market leader in the Analytics domain. A lot of top and mid-sized banks have analytics as a separate operating division. Retail has a lot of untapped potential which is yet to adopt on the sales and marketing front; although on the inventory side, we have observed some growth. E-commerce is blooming in this domain. Manufacturing has also adopted analytics on the inventory side, whereas healthcare sector has just seems to have been introduced to it. Here are a couple of trends in the analytics segment you can leverage upon –

LEADING CITIES HIRING IN ANALYTICS (2014)

  • BANGALORE
  • DELHI
  • GURGAON
  • NOIDA
  • MUMBAI
  • HYDERABAD
  • CHENNAI
  • KOLKATA

Bangalore, Hyderabad and Pune are the hubs for Big Data in India and have the most number of open Big Data jobs.

GROWTH OF ANALYTICS IN INDIA

  • The initial success led to a large number of global multinational corporations (MNCs) across the banking, insurance, retail, telecom, automotive and consulting sectors to set up in-house (captive) analytics centers of excellence.
  • Some of the captives offer analytics as a service to their customers, leading to the rise of third-party service providers.
  • IT services companies and BPO service providers have seen analytics as the next level of value addition and diversified into delivering analytics services for their clients.
  • Boutique analytics solution providers have emerged, with specialization in a specific industry vertical or a functional domain, to deploy deep analytics expertise.

peepal

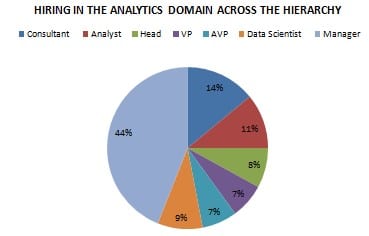
The pie chart here shows the hiring pattern in the analytics domain across the hierarchy, percentage wise.

The list below shows the salary range across hierarchy in the analytics domain –

Fresher’s Salary – 2005 – 1,80,000 LPA

Fresher’s Salary – 2014 –  6,00,000-12,00,000 LPA

Senior Business Analyst – 12,00,000-15,00,000 LPA

Team Lead – 15,00,000-25,00,000 LPA

Analytics Manager –  25,00,000-40,00,000 LPA

Effect on Analytics Salaries in the next 5 years

– The entry level salaries in analytics are expected to grow at 10 to 20% per annum at least for the next 5 years.

– Professionals in the analytics industry can expect annual pay hikes of about 15% every year.

– Average time for promotion is 18 to 24 months at the lower levels and 2 to 5 years as you move up the hierarchy.

According to a Gartner report in 2014, big data is predicted to create 4.4 million jobs by 2016. As an HR professional, you know there are many decisions dependent on getting incisive information on the talent flow. What are your thoughts on this? Please feel free to write to me on manjushri.shenoy@analyticspeepal.com. You could also call me on +91-9845333518.

Have a great year ahead!

Manjushri Shenoy

manjushri.shenoy@analyticspeepal.com

+91-9845333518

(Visited 115 times, 6 visits today)

The post Analytics trends 2014 – Place your bets appeared first on Analytics India Magazine.

Jigsaw Academy’s Predictions for the Analytics and Big Data Industry in 2015

$
0
0

tumblr_nfaza1lxj11tomxvuo8_1280

India’s leading online school of analytics, Jigsaw Academy, has released its annual predictions for the Analytics industry for 2015. The following are the key predictions.

Government investing in Big Data:

The single most important prediction by Jigsaw is that Governments will spend more on Big Data. According to Jigsaw, the industry will witness several instances of predictive analytics using Big Data systems. The Governments’ sensitivity towards Big Data and its potential will also increase in 2015 and more data will be available publicly. “Governments will embark on several initiatives leveraging Big Data – from trying to improve national security to solving infrastructure problems. Already, the Prime Minister’s Office is using Big Data Analytics to process citizen’s ideas and sentiments through the crowd sourcing platform mygov.in and implementing an attendance system for India’s Central Government employees through attendance.gov.in. Similarly, the state Government of Telangana is employing Big Data Analytics for the data collected from nearly 3.5 crore people across strata,” said Gaurav Vohra, CEO of Jigsaw Academy.

Gujarat’s emergence:

Gujarat will emerge as the fourth centre for Analytics after Mumbai, Bangalore and Delhi. The number of analytics companies based in Gujarat has been on the rise due to which there will be an increased demand in that region for trained data scientists.

Advent of Personalized Analytics:

Another key prediction is that Personalized Analytics will create a lot of buzz as it will be taken to new levels. This includes data from wearable devices, which will gain popularity and have an impact on healthcare, as well as professional sports. Wearables will have smarter algorithms for data correlation, and start to enter the workplace. More importantly it will impact our daily lives and we will see this data make positive changes to our lifestyle. Wearables like ‘Smart Glasses’ will see larger enterprise adoption, particularly in those sectors and for those jobs where hands-free gadgets has the potential to improve efficiency as in the case of doctors. Smart smartphone cases will double as a medical device.

Talent with programming skills and Open Source will benefit:

And finally, Jigsaw predicts Analytics recruiters will place much more emphasis on programming skills and expertise in Open Source tools and technologies. As Open Source Analytic tools become more popular, companies will look to hire those with programming skills, as well as competence in Open Source.

(Visited 111 times, 8 visits today)

The post Jigsaw Academy’s Predictions for the Analytics and Big Data Industry in 2015 appeared first on Analytics India Magazine.

“A Heuristic Approach to Predictive Modeling, RFM Analysis” by Myra School of Business: Ashutosh, Sangitha, Nitish, raghuveer, SriValli and Mihir, under Prof Purba Rao

$
0
0

Man Reading the Definition of Analytics

This paper discusses the basic postulates of Recency, Frequency & Monetary (RFM) analysis, a heuristic modeling approach, used in Predictive Analytics, to segment a target market into preferred segments and not so preferred segments. The preferred segments are characterized by their high response rate or high willingness to purchase as opposed to other segments which are not as preferred.

The paper also exemplifies these concepts with the help of a case study in the tele- communication sector where a company uses an existing data base to arrive at RFM categorization as well as identifies the profile of customers in the preferred segments.

Introduction

Predictive modeling, the way it is understood in the Business Analytics context, is a way of predicting consumer behavior by analyzing a database either existing in the company concerned or on a database created with the help of an empirical survey. Essentially, a modeling approach, predictive modeling helps the company to identify profiles of consumers who would be more likely to purchase a product or a service which the company might be offering to a specified and defined target market. Applications of predictive modeling can be seen over different industries and in different managerial functions.

For instance, for an entrepreneur offering a new product in a specified target market, predictive modeling can help in understanding the consumer needs and preferences with respect to the attributes defining the product.  For a service oriented company it can help to determine the profile of the most preferred segment and predict the percentage of customers who may actually purchase a new service being offered. For a credit card company or an organization offering loans of any kind, predictive modeling may evolve guidelines as to what kind of consumer profile would merit a preferred treatment and to whom loans may be extended with a softer level of interest.

Once the predictive modeling  context is well understood and  the objective in terms of what phenomenon  is to be predicted has been clearly stated, the approach would define measurable variables for each item of the in the situation … the predictor  variables… as well as the variable to be predicted … the dependent  or target variable.

Thereafter the predictive modeling uses either:

(a)Analytical approach like Logistics regression, Linear Regression Analysis, Factor and Cluster Analysis, Conjoint analysis, or

(b)Heuristic approach… like RFM analysis, or

(c) Data mining approach, which combines Heuristic and Statistical approach such as Classification Trees.

This paper proposes to discuss the basic concepts of the Heuristic Approach of RFM Analysis and provide an example of RFM Analysis applied on the database of a company operating in the telecommunication field in India.

Predictive Modeling and RFM analysis.

In strategic decision making companies often strive to determine who are the most valuable customers whom they would give special privileges to, invest to build up long term relations with, say in a CRM scenario, or target offers for mail orders, catalogue buying or any kind of direct marketing initiatives. The objective, in most of such situations, is to find out who the most likely buyers are, who makes purchases most frequently, who spend the most and who have the greater probability of coming back for repurchase.  In many such initiatives, RFM analysis, recency-frequency-monetary analysis, helps identify consumer segments and customer profiles having such characteristics.

‘The fundamental premise underlying RFM analysis is that customers who have purchased recently – , have made more purchases and have   made larger  purchases are more likely to respond to your offering than other customers who have purchased less recently, less often and in smaller amounts.’

[Charlotte Mason, 2003, University of North Carolina].

The analysis helps an organization to focus on a smaller section of the target population which again follows another managerial premise, Pareto Principle that 80 % of the business comes from 20 % of the customers.

In the past 30 years, direct mailing marketers for non-profit organizations have used an informal RFM analysis to target their mailings to customers most likely to make donations. The reasoning behind RFM was simple: people who donated once were more likely to donate again. Currently, with the availability of CRM software and the use of e-mail marketing, RFM analysis has become an even more important tool. Using RFM analysis, customers are assigned a ranking number of 1,2,3,4, or 5 (with 5 being highest) for each RFM parameter. The three scores together are referred to as an RFM   composite score. The database is sorted to determine which customers have been the best customers in the past, with a composite score “111″ being ideal. Of course, in some organizations marketers consider 5 to be the most preferred RFM parameter, in which case ‘555’ would be the most preferred customer.

(http://searchdatamanagement.techtarget.com/sDefinition/0,290660,sid91_gci751219,00.html)

There are many justifications as to why RFM analysis works. Customers who bought most recently from an organization, are more likely to respond to the next promotion than those whose last purchase has been way back in the past. This is a universal marketing phenomenon and has been observed in many industries such as insurance, banks, cataloging, retail, travel, etc. In a similar manner, customers who have purchased frequently are more likely to respond than the less frequent ones. Also customers who are big spenders often exhibit much higher response rates than small spenders.

HOW CAN ANALYTICS HELP

Analytics is increasingly being used as a tool to solve complex organizational problems – leading to better decisions. These are the decisions which were once taken solely by gut instincts.

The success of any company in the Telecom industry currently depends on two broad factors –

  • Ability to add new subscribers (both data and voice)
  • Ability to retain existing subscribers (Since, Mobile Number Portability is now available by all operators)


This paper focuses on the second part, which is on the indicators which would help the company minimize the tendency of subscribers to switch from their service to others. One of the major indicators of this tendency is measured by Port-in Port-out ratio (it is also commonly referred to as Churn).

The number of subscribers switching to a given provider from others is referred to as Port-in. Port-out indicates the number of subscribers switching to a different provider from the given company. A port-in port-out ratio of less than 1, hence, is good for the company because more subscribers are coming in than out. If the ratio is greater than 1, it is considered bad for the company.

There are two ways of making this ratio healthy – increase the number of port-ins or decrease the number of port-outs. In order to do so, the company would need to strategically connect with the individual subscriber base – the better their needs are taken care of, the less likely it is that they will switch to other provider.

Keeping the above fact in mind, a telecom provider usually comes up with a number of plans to woo the existing customers. This comes with a catch though. It is almost impossible to roll out tailor made plans for every subscriber – such would be too expensive. At the same time, covering the entire subscriber base with a few plans would not go down well with specific consumers whose needs might be different.

One solution might be to come up with a plan, say, ‘Pay-Per-Use’ plan – and in order to do so, a broad survey of consumers is required – most of their usage details are already with the company. It is their preferences which need to be mapped with their eagerness to take up a new plan from the same provider instead of switching to another service provider. This new service was called ‘dataplan’ by the telecommunication company.

Thereafter the company wished to use Analytics to help identify, who among the existing subscribers are most willing to take up the new plans. It is with this end in mind, that the data has been collected, data base was constructed and analyzed. The database elements have been discussed in the next section.


Authors

  1. Raghuveer Kodali=picRaghuveer Kodali holds a Bachelor’s degree in Electrical and Electronic engineering, from DVR & DR and is currently pursuing his MBA from Myra School of Business, Mysore. HS MIC College of Technology. His Internship in Market Research for a product UNIled In Kwality Photonics. He is Interested in Analytics and Market Research.
  2. Nitish=picNitish holds an MBA degree in Marketing & Strategy from MYRA School of Business, Mysore. He has done his Bachelor of Technology in Mechanical Engineering and has about two years of experience in manufacturing domain. He is an automobile enthusiast and likes to travel.
  3. Sangitha Ajith=picSangitha Ajith is an MBA student in Marketing & Strategy at MYRA School of Business. She holds a degree in Bachelors of Commerce from Mysore University. She spent her summer interning in Brandcomm as marketing analyst. Her interests lie in creative art.
  4. Sri Valli=picSri Valli holds a PGDM degree in Finance & Analytics from MYRA School of Business, Mysore. She had done Bachelor of Technology in Computer Science and Engineering. She is an avid puzzle solver with a special interest in Rubik’s cube.
  5. Ashutosh Kar=picAshutosh Kar holds a Bachelors in Computer Science & Engineering from Jaypee University of Information Technology. After working with Data Warehouses and Business Intelligence tools for 6 years in various IT companies like ORACLE & IBM, his interests shifted to finance and mathematics. He is currently pursuing his MBA from MYRA School of Business, Mysore. His academic interests include dynamic optimization and optimal control theory.
  6. Mihir Ghosh=picMihir Ghosh: Academic Background – PGPX Executive MBA from MYRA School of Business. Graduated from IIT Kharagpur in the field of Dairy and Food Engineering. Experience – 7 Yrs and 4 months professional experience in project sales and marketing in food, pharmaceutical and life science sector.
(Visited 184 times, 5 visits today)

The post “A Heuristic Approach to Predictive Modeling, RFM Analysis” by Myra School of Business: Ashutosh, Sangitha, Nitish, raghuveer, SriValli and Mihir, under Prof Purba Rao appeared first on Analytics India Magazine.

Great Visualizations – Examples

$
0
0

As the trend shows or the results from the past research, the amount of data generated in last 2 years is much more than the data collected 100 years before. Today’s world is mostly data driven where most business and strategic decisions taken are based on insights of the data.

Getting right content to right people at the right time is essential, which should be unique identity of an analytics division & also be able to handle large scale of data via non-traditional analytic techniques and visualizes it in real time.

The accuracy, integrity and clarity of solutions through Visualization techniques should be a perfect mix of 6W’s (What, When, Where, Why, How & Who) which plays an integral part while connecting to managers for the daily attention and focus.

Let’s dive into few legendary Visualizations

Charles Joseph Minard: Napoleon’s Retreat From Moscow (The Russian Campaign 1812-1813)

  • Story of losing soldiers on a journey towards east & while returning how they lost how many soldiers crossing a river, how much soldiers could not survive in cold.
  • Temperature, date, and man count are interpolated between the distributed data points. Losses are assumed to occur gradually, counts are assumed to represent the number of men at the beginning of a given leg. Additional data-points were added to adjust the timeline to the battles of Maloyaroslavets, Vyazma, and Berezina.
    Move your mouse pointer onto (or tap) the map’s description for a translation — or a French transliteration — of the original text (http://www.masswerk.at/minard/)

sovan1

Visualization of PI.

  • On October 17, 2011, Shigeru Kondo concluded 371 days of computing 10,000,000,000,000 decimal places of Pi, roughly 44 TB disk was needed to perform the computation, and 7.6 TB of disk was needed to store the compressed output of decimal and hexadecimal digits.
  • 10 trillion verified decimals of Pi calculated by a computer, but this visualization shows 40, 00,000 of those. Every single dot represents decimals (Roll over the plane and see the effect) (http://two-n.com/pi/)

sovan2

Map by Dr. John Snow

  • The September 1854 cholera outbreak was centered in the Soho district, close to Snow’s house. Snow mapped the 13 public wells and all the known cholera deaths around Soho, and noted the spatial clustering of cases around one particular water pump on the southwest corner of the intersection of Broad (now Broadwick) Street and Cambridge (now Lexington) Street.  He examined water samples from various wells under a microscope, and confirmed the presence of an unknown bacterium in the Broad Street samples. Despite strong skepticism from the local authorities, he had the pump handle removed from the Broad Street pump and the outbreak quickly subsided.
  • Dark points shows the deaths and if carefully observed all deaths were concentrated around a water pump.

(https://www.udel.edu/johnmack/frec682/cholera/)


sovan3

The earliest form of written communication is visual, & are symbolized as the pictures represent the way of communication.

As communication evolved we used to communicate complex ideas through texts, but that has not worked well for numbers. We can easily decode numbers much more easily and quickly by visual form.

Why is that?

  • 30-50% of brain devoted to visual processing.
  • Around 70% of sensory receptors in analyzing.
  • It makes tenth second to make a visual sense, really just at a glance of an eye.

If we have a close look into John Snow and Napoleon’s visualizations we can notice the positive sides of the analog part of storytelling i.e.

  • Speed (ideas with pen and paper moves very fast)
  • Flexibility (modification with as many experiments possible)
  • Scale (Which will not possible in modern era’s small screen like a computer)
  • Good body-mind connection (Very comfortable)

All are about brain storming. Point to go for analog is that its natural and it reduces the layers of things between me and my idea. I can move quickly, can generate as much ideas as possible. I can comfortable on it and can’t go wrong easily.

Story telling

Visualization is just more than data or charts or maps, at their best they are stories. Humans being telling each other, stories as their primary means of communications from tens and thousand years.

As stories have simple structure, you can force audience to follow the linear progressive way rather data’s complex face & you can’t tell about Hollywood or Bollywood in English in the jungles of Amazon. You have to relate to their language and their culture and scope of understanding (most importantly you need to know what they don’t know)

In the end

Why we communicate visually

  • Tangibility: We can turn data & numbers into tangible where people can relate to, (charts or illustrations)
  • Simplification: Will help you reduce text, help convey information easily and quickly
  • Context setting: Visuals can reduce distraction, help to grab attention, really help to establish themes by infographics
(Visited 227 times, 1 visits today)

The post Great Visualizations – Examples appeared first on Analytics India Magazine.

Analytics India Salary Study 2015 – By AIM & Great Lakes Institute of Management

$
0
0

Banner_Website

In the past couple of years, data analytics has grown from being a discretionary spend area to a service that is a need for competitive advantage. Not only are businesses looking at internal well-structured corporate or customer data but also are exploring large external data sources (on social networks, internet, e-mails, text documents, etc.), which are usually unstructured, and need to be combined with structured data to conduct meaningful analysis. Managing the sheer volume, variety, and velocity of data that is being generated (with the innumerable technological interface devices) is a relatively new challenge for the typical business organization.

Thus, the demand for trained analytics and big data professionals is increasing at a tremendous rate. Supply is still very constrained and this means that over half the positions on offer still remain vacant making it a lucrative career option for professionals.

This annual Analytics India Salary Study 2015 is an initiative by Analytics India Magazine in partnership with Great Lakes Institute of Management to highlight the salary trends in the industry across cities, experience levels and sectors.

Key Trends

In the past few years there is a rise in demand of the data analytics professional and the overall salary trends look very optimistic.

Overall Salary Trends:

  • The overall average salaries of analytics professionals across the country is 4 lakhs per annum. This is across seniority levels and expertise.
  • The average salaries for analytics professionals increased by 21% from the same time last year. This is an excellent increase given that the recruitment at entry level has been high last year. The salaries for mid to senior levels professionals have increased in the range of 25-40% last year.
  • 14% of all analytics professionals command more than 15 lakhs salary. 37% command less than 6 lakhs
  • Almost 12% of entry level professionals in analytics command more than 6 lakhs

Salary Trends across Cities:

Salaries across Cities

  • Mumbai pays the highest salary to analytics professionals at an average of 9.9 lakhs per annum, marginally higher than Bangalore at 9.8 lakhs average.
  • After Mumbai, Bangalore and NCR, Pune has the highest average salaries at 8 lakhs per annum.
  • Among cities, Hyderabad had the highest year on year hike in salary at almost 25%.
  • In Mumbai, there are more analytics professionals in the 10 – 25 lakh range salary than any other city (at 31%).

Percentage of professional across salary brackets

Key inferences:

  • The number of professionals in the high income bracket is low and the majority of professionals are employed at a fresher or senior analyst level across India. This is in line with the expectation where when an area grows in volume, more of junior level professionals are required.
  • Though Mumbai has traditionally offered the highest salaries because of its high cost of living and the trend still continues, Bangalore is fast catching up and its salaries are almost at par with that of Mumbai now.

Salary Trends across Experience Levels:

Salaries across Experience Levels

  • From Analyst (0-3 years) to Senior Analyst (4-6 years), an analytics professional can expect almost 75% average hike in the salary. From Senior Analyst to Assistant Manager (7-9 years), it is almost 57%.
  • Almost 85% of all analytics professionals in India with more than 12 years of experience can expect to have more than 15 lakhs per annum 45% have more than 25 lakhs per annum salary.

Key inferences:

  • Things are a lot perkier as a data analyst and trends show that at each level salary increment is upwards of 50%. The biggest jump in salary is from the Analyst’s to a Senior Analyst’s level.
  • At the Director’s level, salaries are much higher in Bangalore, Delhi/NCR and Mumbai in comparison to Pune, Chennai and Hyderabad. At the Analyst’s level, salaries are almost at par across the cities.

Salaries across Industries

Salary Trends across Industries:

  • Ecommerce emerged as the highest paymaster paying its analytics professionals an average salary of 12.9 lakhs per annum.
  • The lowest paymasters were the Media/Advertising and Pharma sectors with average salaries of 5 and 8.1 lakhs per annum respectively.

Key inferences:

  • In general captive centres (eg: ecommerce, retail, telecom) paid higher salaries to retain their talent.
  • As compared to captives, analysts that work for service providers either in the IT/ITES or Media/Advertising sectors have the opportunity to move around domains and gain expertise. This is the advantage that affords service providers the luxury of paying lower salaries but still attracting high quality talent.

Conclusion

Analytics drives insights and insights lead to better decisions. As businesses find themselves in an era of unprecedented competition and changing economic landscape, data analytics is the crucial component that can help them build a competitive advantage and make well-informed choices. Businesses of all sizes today are waking up to this realization and to help these businesses realize their analytics goal, the skilled analytics professional is looked as the saviour of sorts.

As a result, the analytics job market will grow like never before and there will be unparalleled opportunities for those with analytic skills. Salaries will continue to increase and we will see professionals from other sectors honing their analytics skills and switching careers. The time for the data-savvy analytics professional is here!


Download the complete report below:

Analytics India Salary Study 2015
Title: Analytics India Salary Study 2015 (262 clicks)
Caption:
Filename: analytics-india-salary-study-2015.pdf
Size: 7 MB

(Visited 4,326 times, 1 visits today)

The post Analytics India Salary Study 2015 – By AIM & Great Lakes Institute of Management appeared first on Analytics India Magazine.


Detecting loan defaults at an early stage using models of machine intelligence

$
0
0

The call for an early detection of risks of default has become louder in the financial world, not least because of the losses incurred in the wake of the financial crisis. The question arises which methods significantly improve the detection rates and deliver this detection at an earlier stage. In the context of a benchmark analysis we discuss and deliver an overview of potential methods and their results. In addition, we quantify the optimisation potential of an established stochastic method versus a new development from the domain of machine intelligence.

The current situation

The aftermath of the financial crisis can be still felt in current insolvency statistics. The number of newly opened insolvency proceedings skyrocketed from 2004 to 2012 (from 95,035 to 137,653) [see Federal Statistical Office, 2013]. This development is reflected in the P&L of banks and jeopardises their profitability. Thus, owing to the increased volume of non-performing loans the provisions for value adjustments and risks of default had to be increased by many institutes.

Understandably, this trend has also mobilised banking supervision and is addressed as a main objective for the latest version of Minimum Requirements for Risk Management (MaRisk) and the “Principles for Effective Risk Data Aggregation and Risk Reporting” published by the Bank for International Settlements (BIS) with respect to the management of loans and an early detection of defaults. However, these alarming signals should not be mistaken for mere forerunners of a future compliance issue. The actual focus of banks should be on the early detection and reduction of credit default risks, thereby reducing the volume of actually defaulted loans and thus the burden on banks’ equity and P&L.

The most effective means against the default of loans is the early identification of non-performing loans. By gaining time, effective measures can be taken to prevent a loss. This could include e.g. the transfer of cash, a change in due date or a restructuring. Sufficient time for a response and taking the correct actions are the biggest assets in successfully handling of a non-performing loan.

Advantages and disadvantages of various early warning systems

What conclusions need to be drawn from these insights to be able to implement an effective as well as efficient early risk detection system? The simple answer is: the system has to offer excellent forecasting abilities to identify non-performing loans early on without delivering too many false positives, i.e. credits incorrectly assessed as being at risk of default. Unnecessarily troubling customers who are not at risk might strain the relationship with the lender beyond repair.

Whether current early warning systems meet these supposedly simple requirements is discussed below. In addition, we demonstrate an alternative to the current practices that fulfils these postulates.

The currently prevalent systems can be categorised as follows:

  • Rule-based systems
  • Option price models
  • Stochastic models

Figure 1 summarises the advantages and disadvantages of each system category.

Below, we discuss an alternative in the shape of systems based on machine intelligence:

loan

Early risk warning systems in times of increasing insolvency proceedings

The analysts at Ernst & Young expect that by the end of 2013, 7.8 percent of the loan amount (corresponding to about EUR 940bn) has to be written off as defaulting loans in the Eurozone – a new record [see Ernst & Young, 2013: EY Eurozone Financial Services Forecast]. According to the same source, however, compared to the rest of Europe the German banks are doing relatively well with a share of defaulting loans of 3.2 percent at present.

However, we have experienced a significant increase in the new openings of insolvency proceeding since 2004, leading to an increase of 45 percent till 2012. But if you recall the situation at the beginning of the new millennium, we can assume that this significant increase in the number of newly opened insolvency proceedings need not be the end of the road by any stretch of the imagination. From 2000 to 2006, the number of proceedings in Germany increased by over 600 percent (from 19,698 to 143,781 proceedings) [see Federal Statistical Office, 2014: Insolvenzverfahren: Deutschland, Jahre, Beantragte Verfahren]. This outlook brings the necessity for an effective as well as efficient early risk warning system right at the centre of attention for banks.

Challenges in the implementation of early warning systems

The above insights suggest that an early warning system using powerful forecasting abilities to detect non-performing loans is a key to preventing defaulting credits.

What, then, are the challenges faced when implementing such an early warning system?

The challenges can be summarised in two basic problem areas: on the one hand the use of a data basis that enables an early identification of non-performing loans, and on the other hand the use of a model that enables a precise and specific identification of non-performing loans.

So far early risk warning systems frequently involve loan officers (manually) evaluating balance sheet data and data on the payment behaviour of debtors. These evaluations are at best discussed in cross-departmental committees which furthermore consider the analysis of the current market situation – also frequently in descriptive form and not through a quantitative analysis. For these analyses, data as well as analysis methods stemming from the expertise of the decision makers are used.

The American economist and laureate of the Nobel Prize for Economics, Milton Friedman, once said that he was interested in the results of forecasting models but not in the underlying methods. What does this statement mean? If the forecasts results are correct, then the plausibility of the model emerging from among various models is of secondary importance. In other words: given valid results, one should also allow models and the use of data whose logic with respect to the observable phenomenon one does not necessarily understand. The economic approach to resolving this issue: let’s have the competition for forecasting quality decide over the use of models and data. And this is exactly what we did in the context of a pilot project – as described in the following section.

Benchmark analysis: stochastic models vs. machine intelligence

The authors have created two early warning models, one for a promising approach from the category of “stochastic models” as a reference model and one for a new representative from the category of “machine intelligence”. The reference model works with standardised key performance indicators (KPIs) that were calculated on the basis of financial figures of Swiss small and medium-sized enterprises (SMEs) and uses the method of logistic regression. (Detailed information on the data used is available from the authors upon request).

The model of machine intelligence additionally uses trends and time series that were determined with the help of market and macroeconomic data. Furthermore, it has the ability to combine methods in order to use the advantages of a specific approach while reducing or eliminating its weaknesses through the other methods.

As a result, non-linear relationships of complex patterns are also detected. The model combines the following methods: ensemble decision tree, automatically detected non-linear functional combinations of attributes, risk-based scaling and logistic regressions.

Apart from the decision on the methods to be used, the question also arises about the point in time when system support should be provided for identifying non-performing loans. On the one hand, this is necessary when monitoring the current credit portfolio of an institute at regular intervals in order to avert impending defaults. On the other hand, for cost reasons potentially defaulting debtors need to be identified at the beginning of the lending process, meaning no loan is granted to representatives of this risk group in the first place and the complex process of handling non-performing loans can be avoided as much as possible.

The forecasting quality of the models is crucial

For determining corporate clients at risk of default in the existing credit portfolio, it is irrelevant for the lending party how well the model forecasts “good risks”, i.e. corporate clients who are not at risk. When evaluating the creditworthiness of applicants at the beginning of the lending process, the system not only has to detect applicants with a high potential credit risk (true positives). In addition, it also has to ensure that not too many applications are rejected whose applicants actually have a low credit risk but were falsely classified as “at risk” by the system (false positives), as otherwise the credit institute would miss out on valid income.

Instead, the forecasting quality in the rating categories with a high risk of default is far more important. As seen in Figure 2, compared to the stochastic model the model of machine intelligence detects approx. 60 percent more defaults for both the highest rating classes.

loan

The number of debtors, the extent of the realised probability of default and the number of realised defaults relate to the debtors assigned in this rating class. When quantifying the losses detected with the help of the different models using the default data of a medium-sized credit institute, the following results emerge:

  • The stochastic model (reference model) can at an early stage detect losses in the range of EUR 110m in the three categories with the highest risk of default (classes 8-10).
  • The model based on machine intelligence (alternative model) can at an early stage detect losses in the range of EUR 150m in the three categories with the highest risk of default (classes 8-10).
  • Assuming that a loss cannot be completely avoided in all the cases detected early on, meaning only up to 10 percent in the reference model and up to 30 percent in the alternative model (improvement due to the optimisation of the model in terms of early detection), then the comparison of models indicates that the model based on machine intelligence delivers additionally averted losses amounting to approx. EUR 35m or 17 percent of the total loss per annum.

The analysis assumes net additions to adjustments and provisions in the credit business amounting to about EUR 200m p.a. that are booked in the P&L.

The temporal aspect of early detection

We now need to address the question whether the assumption is justified that by using the model based on machine intelligence 30 percent instead of 10 percent of detected potential losses can be prevented. As mentioned above, the temporal aspect is crucial for the success of any measures taken. If we not only compare the results of better detection, as in the figure above, but also consider this temporal effect, then the picture becomes even more clear. Figure 3 shows that the model based on machine intelligence is as well in the lead in this discipline. Almost 20 percent of the defaults are detected two years before the stochastic model, and over 50 percent are detected at least one year ahead of the reference model. When one gets a minimum of one year of additional time for 70 percent of the impending losses to identify appropriate measures to avert loan default together with the client, then in our opinion this substantiates the above assumption.

loan

Summary

Credit institutes face a situation where we see an increasing number of loan defaults. This trend is likely to intensify with rising interest rates, as the first years of the new millennium suggest. Therefore, now even regulators demand the implementation of early warning systems helping to detect risks early on and with high confidence.

These criteria were used as target values of a benchmark analysis for the data of Swiss SMEs. For the purposes of this analysis, a model was prepared for two representatives from the most promising system categories. The analysis shows that the models from the field of machine intelligence deliver superior results. In the above example of a medium-sized credit institute, additional losses amounting to approx. EUR 35m p.a. could have been prevented by using this model.

Given these results, it should only be a matter of time until the methods of machine intelligence are used more frequently to monitor credit risks. This holds even more true in the light of the constant urge to identify and leverage available potentials to reduce costs.

authors:

Michael Strumpf

Michael Strumpf has a 15 years experience in consulting of various risk management topics with a strong focus on the application of machine learning techniques since 6 years. He covers topics like early warning systems for market, credit and liquidity risk, fraud detection (card, payment and internal fraud) as well as sales optimization and client segmentation. He holds a Master in Economics from the University of Zurich and the Financial Risk Manager of GARP (Global Association of Risk Professionals).

michaelstrumpf1968@gmail.com


Christian Schaefle

Christian Schaefle, CEO System Design Consulting Prospero AG (www.prospero.ch), has 25 years professional experience in controlling and management information and the design and realization of decision relevant information systems. The special focus are business solutions based on machine intelligence. He holds an MBA from the university of St. Gallen.

www.prospero.ch

c.schaefle@prospero.ch


(Visited 181 times, 3 visits today)

The post Detecting loan defaults at an early stage using models of machine intelligence appeared first on Analytics India Magazine.

Analytics India Leaders Outlook -2015

$
0
0

Business outlook

We at Analytics India Magazine have always tried to bring the community together and provide information about the industry that is not otherwise assessable to all. Supporting this initiative we bring to you what the leaders of Indian Analytics forecast about the industry for the next 1 year.

Analytics India Leaders outlook Survey reveal the perspectives of leaders in India on the analytics industry for next twelve months. We surveyed 45 individuals across the industry from the ranks of key decision makers for this study. Overall, the responses have been extremely positive and sentiment looked ‘up’ for the year ahead.

Here’s the profile of our respondents.

Business outlook

98% of respondent are confident that the demand of Analytics at their organization will increase in next 12 months.

We asked regarding their confidence about analytics being a key focus area for organizations globally over next 12 months –

  • 36% respondent gave a 10/10 score
  • Just 7% respondent gave a score of less than 7 out of 10.
  • Average Confidence score was 8.6/10

Business outlook

We calculated the Net Sentiment Score (Calculated as difference of % with score of 10s & 9s and Score from 0 through 6s), at 49%. This is an exceptionally high sentiment score.

 Business outlook

96% of decision makers plan to increase their analytics workforce in next 12 months. Only 4% believe that they have no hiring plan for the coming year. Across the industry medium to large organizations are trying to build analytics COE. Majority of them are new to this and are looking out to hire talent to fulfil their requirement.

67% decision makers believe that ‘Unavailability of Analytics Talent’ is the major challenge that they face. This is in line with our earlier findings and is widely documented and spoken about. There is a huge demand for Analytics professionals across levels. The pool of resources is not sufficient to fulfil the current requirements. While the industry is collaborating with several institutes and organizations to fulfil these demands, the quality of professionals and experience still remains challenge.

Business outlook

What’s came out as an interesting outcome is that 58% of leaders believe that ‘Little knowledge of analytics among customers’ is a major challenge for them. Obviously, we have not done enough to propagate analytics understanding to a wider audience in the market. While Analytics and big data has been a buzz word around the network, very few understand how they can encash on it. And even fewer can identify the key areas within their business to apply it to.

Few leaders are wary of competition, just 18% believe it’s a challenge for them. Only 20% believe that analytics demand has peaked. The number of key players is still limited. While we have quite a few start-ups coming up, the demand for expertise to fulfil the current industry requirement is quite high.

Business outlook

‘Digital/ online/ Mobile/ Social’ is considered as a top area of growth in analytics by 62% of respondent. ‘HR/ Talent/ People’ is considered as a growth area by just 13% respondent. Obviously, the adoption of analytics in this is slow, that might change over time when real benefits begin to emerge.

(Visited 487 times, 2 visits today)

The post Analytics India Leaders Outlook -2015 appeared first on Analytics India Magazine.

Applying Analytics to Sustainability Concerns

$
0
0

Applying Analytics to Sustainability Concerns

Authors 

Anuj Rawat, Great Lakes Institute of Management, Chennai, anujrawat6@gmail.com

Goutam Sankar Behera, Great Lakes Institute of Management, Chennai, behera.goutam.sankar@gmail.com

Vidhul Dev, Great Lakes Institute of Management, Chennai, vidhuldev@gmail.com

Purba Halady Rao, Great Lakes Institute of Management, Chennai, Purba.h.rao@gmail.com

ABSTRACT

Purpose – It is widely known that Chennai is fast developing into a manufacturing hub. Although it is a big growth engine, this growth will hurt environmental sustainability. However, if organizations plan to adopt green supply chain practices, there must be a basic active evidence linking greening to economic and competitive performance. This paper attempts to find this link among a sample of small and medium enterprises (SMEs) from Chennai.

Design/methodology/approach – A conceptual model was developed based on the extant literature, and data was collected using a structured questionnaire mailed to a sample of SMEs in Chennai, followed by structural equation modelling. The conceptual model endeavored to seek significant linkages involving green supply chain components (Greening of Inbound Logistics, Greening of Production Function, and Greening of Outbound Logistics) and environmental performance, competitive advantage, and economic performance. The methodology used was Structural Equation Modeling (SEM).

Findings – The model showed  significant linkage from Greening Initiatives on the Inbound Phase to Production phase, which leads to Environmental Performance as well as to Competitive Advantage and Economic Performance. Environmental  performance may not be a pre requisite to Economic Performance ( as observed in the final model) but environmental performance does lead to competitive advantage significantly.

Though there is no direct relationship between Greening the Inbound Logistics to Economic Performance or Competitive Advantage, it is Greening of Inbound which ensures that Green Production is achieved, which drives the firm towards creating and maintaining Competitive Advantage.

INTRODUCTION

Organizations across the world have integrated various innovative concepts such as environmental sustainability, responsible manufacturing, customer empowerment, adherence and compliance to standards, sustainable waste management, reverse logistics, etc. into their overall company strategy. However, there has not been a major study to establish the impacts of these initiatives on the performance of the firm in the context of small and medium enterprises (SMEs) in India.

This study examines the effects that greening the supply chain has on the competitiveness and economic performance of SMEs based in Chennai. In India, the growing manufacturing need is pushing the growth of this sector; simultaneously, it is reducing the environmental burden. Most of the big manufacturers are moving towards higher standards in response to their customers’ demands (many of whom are situated abroad). Owing to this shift, there is a substantial emphasis on greening the manufacturers’ supply chain, which involves their supplier groups, distributors, retailers, customers, and other business partners. This emphasis is reflected in their endeavour to achieve a triple bottom line in their corporate vision. Green supply chain management (GSCM) is part of this endeavor to achieve a triple bottom line.

The objective of this research is to investigate to what extent GSCM has been established and implemented for SMEs in Chennai and to determine the degree of correlation of the GSCM initiatives with the environmental performance, economic performance, and competitive advantage of the SMEs.

Green Supply Chain Management

The basic framework of a green supply chain involves the following components (Sarkis, 1999; Rao, 2002):

  • greening the inbound function of the supply chain
  • greening production or internal supply chain
  • greening the outbound function of the supply chain.

This research aimed to explore the relationship among these GSCM components and a firm’s environmental performance, economic performance and competitiveness.

The conceptual model examined in this study (Rao & Holt) was developed through an examination of the extant literature on all aspects of the totality of the supply chain. This “totality” is encapsulated using five latent constructs, measured using indicator variables developed from the responses obtained from a survey of various organizations in South-East Asia. These constructs are:

  • Greening the inbound function of the supply chain
  • Greening production or internal supply chain
  • Greening the outbound function of the supply chain
  • Environmental performance
  • Competitiveness
  • Economic performance

(Rao and Holt, 2005)

Empirical Research.

Sample

An empirical, survey-based research approach was adopted, involving 64 items in the survey questionnaire. This questionnaire was distributed to the environmental management representative (EMR) or the chief executive of SMEs in Chennai.

The final sample size was 99.

Results of the Study.

The database created from the survey conducted was analyzed using Structural Equation Modeling approach (SEM approach) and the following final model was obtained.


sustanability

Notes: Bold lines show significant link, dotted lines show links that are not significant.

The model showed a significant linkage from Greening Initiatives on the Inbound Phase to Production phase, which leads to Environmental Performance as well as to Competitive Advantage and Economic Performance. Environmental  performance may not be a pre requisite to Economic Performance ( as observed in the final model) but environmental performance does lead to competitive advantage significantly.

Though there is no direct relationship between Greening the Inbound Logistics to Economic Performance or Competitive Advantage, it is Greening of Inbound which ensures that Green Production is achieved, which drives the firm towards creating and maintaining Competitive Advantage.

Greening of Inbound Logistics includes activities such as green sourcing, greening of suppliers, and using materials that do not generate hazardous waste. These initiatives are reflected in the operations of the firm through Greening of Production, which leads to Environmental Performance, which can be judged through waste reduction, recycling, reduction in emission, etc. Over a period of time, these practices would provide sustainable competitive advantage to a firm in the market, as observed from the significant link between environmental performance and competitive advantage.

Download the complete paper here:

Applying Analytics to Sustainability Concerns
Title: Applying Analytics to Sustainability Concerns (54 clicks)
Caption:
Filename: applying-analytics-to-sustainability-concerns-2.pdf
Size: 970 kB

(Visited 257 times, 1 visits today)

The post Applying Analytics to Sustainability Concerns appeared first on Analytics India Magazine.

Analytics India Industry Study 2015

$
0
0

study

Analytics India Industry Study in a yearly study that we undertake with an aim to provide an idea of where most of the action is happening in Indian analytics industry. We take up month’s long study from both primary and secondary sources to compile this in-depth analysis on number of analytics professionals in India and the top cities, companies etc. We welcome your thoughts/ feedback on this.

Analytics India Industry Study 2013

Analytics India Industry Study 2012

India accounts for 9% of analytics professionals’ worldwide. This number is consistent since past 4 years, given our estimate that the number of analytics professionals in India has more than doubled in past 2 years. We would re-iterate our belief that there is huge leg room available for world’s analytics work to come to India.

% Contribution of Analytics Professionals by Cities

NCR (New Delhi, Gurgaon & Noida combined) continues to contribute highest analytics professionals in the country at 29%, followed by Bangalore at 26%. Pune has scaled up by 1 rank from being at 6th place to 5th place by % of analytics professionals in India.

The top ten analytics employers (in terms of employee numbers in analytics) are TCS, Accenture, Cognizant, IBM, Genpact, Infosys, Wipro, HP, Deloitte and HCL.

University of Delhi, Mumbai, Pune and Bangalore provide the largest number of analytics professionals in the country.

% Analytics Professionals by Years of Experience

The average years of work experience of analytics professionals in India is 6.9 years. This is a slight increase of 0.5 yrs in last 2 years. 48% of analytics professionals in India have less than 5 years of work experience, 19% have more than 10 years of experience.

This year the industry added less than 10,000 fresher in the analytics workforce (people with 0-1 years of work experience). 17% of analytics professionals are in leadership position (VP/Director/ CXO/ Partners), an increase of 2% from last year.

In terms of open positions, 30% of all analytics job opening in India are for junior level, 63% job openings are for Mid-level and 7% for senior level.

study 1

(Visited 1,362 times, 5 visits today)

The post Analytics India Industry Study 2015 appeared first on Analytics India Magazine.

10 Essential Analytics Books by Indian Authors

$
0
0

top books

Here’s a compilation of 10 analytics/ big data books by Indian authors that we believe have made their mark worldwide. We do celebrate the authors but more than that we celebrate their creations in these fabulous books.

Also included is theiramazon web link and the synopsis.

top booksWeb Analytics 2.0: The Art of Online Accountability & Science of Customer Centricity

  • Avinash Kaushik

Web Analytics 2.0 is the perfect follow-up to the bestseller Web Analytics: An Hour a Day as it expands upon the lessons learned, delves into more advanced techniques and covers the absolute latest web analytics tools and methods. Because it is agnostic regarding web analytics tools and will cover such hot topics as measuring video content, blogs, Flash content and social media, it will have exceptionally wide appeal and be a must-read for all web analytics practitioners, including those who read the first book.

top books

  • Vignesh Prajapati

If you’re an R developer looking to harness the power of big data analytics with Hadoop, then this book tells you everything you need to integrate the two. You’ll end up capable of building a data analytics engine with huge potential. Approach Big Data Analytics with R and Hadoop is a tutorial style book that focuses on all the powerful big data tasks that can be achieved by integrating R and Hadoop. Who this book is written for This book is ideal for R developers who are looking for a way to perform big data analytics with Hadoop. This book is also aimed at those who know Hadoop and want to build some intelligent applications over Big data with R packages. It would be helpful if readers have basic knowledge of R.

top booksBig Data and Analytics

  • Seema Acharya, Subhashini Chellappan

This book is a comprehensive coverage on the concepts and practice of Big Data, Hadoop and Analytics. From the Do It Yourself steps and guidelines to set up a Hadoop Cluster to the deeper understanding of concepts and ample time-tested hands-on practice exercises on the concepts learned, this one book has it all! Big Data and Analytics is a term used for massive mounds of structured, semi-structured and unstructured data that has the potential to be mined for information.

top booksBig Data Analytics

  • Arvind Sathi

Bringing a practitioner’s view to big data analytics, this work examines the drivers behind big data, postulates a set of use cases, identifies sets of solution components, and recommends various implementation approaches. This work also addresses and thoroughly answers key questions on this emerging topic, including What is big data and how is it being used? How can strategic plans for big data analytics be generated? and How does big data change analytics architecture? The author, who has more than 20 years of experience in information management architecture and delivery, has drawn the material from a large breadth of workshops and interviews with business and information technology leaders, providing readers with the latest in evolutionary, revolutionary, and hybrid methodologies of moving forward to the brave new world of big data.

top booksBig Data Analytics Beyond Hadoop: Real-Time Applications with Storm, Spark and more Hadoop Alternatives

  • VIJAY AGNEESWARAN

When most technical professionals think of Big Data analytics today, they think of Hadoop. But there are many cutting-edge applications that Hadoop isn’t well suited for, especially real-time analytics and contexts requiring the use of iterative machine learning algorithms. Fortunately, several powerful new technologies have been developed specifically for use cases such as these. Big Data Analytics Beyond Hadoop is the first guide specifically designed to introduce these technologies and demonstrate their use in detail. An indispensable resource for data scientists and others who must scale traditional analytics tools and applications to Big Data, it illuminates these new alternatives at every level, from architecture all the way down to code. Dr. Vijay Srinivas Agneeswaran shows how to evaluate and choose the right tools and then reengineer your solutions and products to work far more effectively in Big Data environments. Agneeswaran explains the Berkeley Data Analysis Stack (BDAS) in detail, including its motivation, design, architecture, Mesos cluster management and the analysis of both performance and accuracy.

top booksBusiness Analytics: An Application Focus

  • Purba Halady Rao

Business Analytics: An Application Focus Business Analytics refers to various categories of analytical approaches for modelling different business situations and arriving at solutions and strategies for optimal decision making in marketing, finance, operations, organizational behaviour and other managerial processes.

top booksApplied Big Data Analytics

  • Ajit Kumar Roy, Pradip Kumar Choudhury

This book, Applied Big Data Analytics is unique among those big-data books because of its great depth and technical approach. It consists of four themes: i)Basics of big data analytics, ii)Tools, techniques and software for analytics iii) Big data analytics in health care sector iv) Big data analytics in industries, bioinformatics and life sciences. With 26 chapters spread over four sections the book demonstrates further the emerging issues and approaches in various areas of Big Data application The aim of this book is to be accessible to researchers, graduate students, and to application-driven practitioners who work in data science and related fields. It is a timely and urgently needed publication, and it provides the most up-to-date, crucial, and practical information for big data management, technologies, and applications. Contributed by experts, it is a must-read book for statisticians, data analysts, IT students, researchers, scholars, and workers with big data in mind. Specialty of this book is that it covers important issues of big data from fundamental knowledge to application in various sectors. With an emphasis on real-life implementation of Big Data technologies, this book will provide bold vision from leading innovators across the data-driven spectrum. The latest tools and trends may help gaining fresh insights and strategic momentum to grow and respond to the analytical requirements.

top booksPractical Business Analytics Using SAS: A Hands-on Guide

  • Shailendra Kadre , Venkat Reddy Konasani

The book begins with an introduction to analytics, analytical tools, and SAS programming. The authors—both SAS, statistics, analytics, and big data experts—first show how SAS is used in business, and then how to get started programming in SAS by importing data and learning how to manipulate it. Besides illustrating SAS basic functions, you will see how each function can be used to get the information you need to improve business performance. Each chapter offers hands-on exercises drawn from real business situations.

The book then provides an overview of statistics, as well as instruction on exploring data, preparing it for analysis, and testing hypotheses. You will learn how to use SAS to perform analytics and model using both basic and advanced techniques like multiple regression, logistic regression, and time series analysis, among other topics. The book concludes with a chapter on analyzing big data. Illustrations from banking and other industries make the principles and methods come to life.

top booksBusiness Analytics: Applications To Consumer Marketing

  • Sandhya Kuruganti, Hindol Basu

Increased customer focus and the exponential increase in the volume, velocity and variety of data and the unrelenting need to stay one step ahead of competition has sharpened focus on using analytics within organizations. With business pressing more on the need to enhance their analytics capability for predicting and optimizing outcomes, this book offers practical guidance on the application of analytics for driving business decisions by adopting a customer centric approach to marketing.

top booksThe Intelligent Web: Search, smart algorithms, and big data

  • Gautam Shroff

As we use the Web for social networking, shopping, and news, we leave a personal trail. These days, linger over a Web page selling lamps, and they will turn up at the advertising margins as you move around the Internet, reminding you, tempting you to make that purchase. Search engines such as Google can now look deep into the data on the Web to pull out instances of the words you are looking for. And there are pages that collect and assess information to give you a snapshot of changing political opinion. These are just basic examples of the growth of “Web intelligence”, as increasingly sophisticated algorithms operate on the vast and growing amount of data on the Web, sifting, selecting, comparing, aggregating, correcting; following simple but powerful rules to decide what matters. While original optimism for Artificial Intelligence declined, this new kind of machine intelligence is emerging as the Web grows ever larger and more interconnected.

Gautam Shroff takes us on a journey through the computer science of search, natural language, text mining, machine learning, swarm computing, and semantic reasoning, from Watson to self-driving cars. This machine intelligence may even mimic at a basic level what happens in the brain.

(Visited 1,265 times, 6 visits today)

The post 10 Essential Analytics Books by Indian Authors appeared first on Analytics India Magazine.

Analytics India Companies Study – 2015

$
0
0

companies study

Analytics India Companies Study is aimed to provide a deeper insights on the analytics companies’ landscape in India. We, at Analytics India Magazine, focus on providing the most comprehensive and in-depth analysis of various aspect of analytics ecosystem in India; be it the salaries/ jobs trends, analytics professionals, data scientists, leaders, education etc.

Here we present to you a bird eye view of the analytics companies in India.

Read Analytics India Companies Study 2013

Read Analytics India Companies Study 2012

The number of analytics organization in India have grown by 4 folds in last 2 years. The reasons are manifold-

  1. Numbers can be deceptive. Most of these companies were already existing and few either incorporated analytics as a line of business or adopted analytics as their primary business
  2. Burgeoning demand for analytics seeing an increase in pure play analytics firms
  3. Growing players in the value chain: training companies, recruitment and consulting firms

But this increase appears disappointing given the growth of analytics firms worldwide. Just 4.5% of analytics firms worldwide are in India or have operations in India. This is in line with our earlier similar study that analytics outsourcing to India is subdued, or even decreasing given the state of analytics worldwide.

A analytics firm in India employs on an average 115 employees. This number is an average of 57 for companies worldwide.

companies study1

Around 72% of analytics firms in India have less than 50 employee strength. This is consistent over the past few years.

companies study1

29% of all analytics firms in India are based out of Bangalore. This is consistent from last year. Mumbai is distant second at 17% of analytics firms. 27% of analytics firms are based out of NCR. Gurgaon has seen a consistent growth in analytics firms over last few years.

companies study1

Delhi has the highest average employee strength for analytics firms at 177 per organization.

companies study1

(Visited 1,073 times, 3 visits today)

The post Analytics India Companies Study – 2015 appeared first on Analytics India Magazine.

Analytics Cities of India

$
0
0

A working man is an able man. Capitalism and globalisation has resulted in creation of plethora of workable jobs and businesses. So much so that locating a job has evolved into discovering the right job, more so recognizing the sought after vacancies. 3 years ago, an article in Harvard Business Review “The sexiest job of 21st century” not only gratified all the Data Scientist of their work but catalysed the gamut of analytics market too. A denomination of being associated with data which has only been a designation in an office has now become a separate programme in universities.  Focused curriculum, bona fide teaching pedagogy, committed faculty and nurturing technology are the outcome of analytics’ thriving demand in the market. Consequently, the educational enterprises are counselled rigorously towards hatching of skilled individuals in the said province. Analytics programmes and certifications in Management Schools, major and minor subject in Analytics, entrusted analytics pedagogue and academic version of analytics software for learning illustrates the adoption of case in point by market and the society.

While Sahil and I are on the verge of submitting our academic project on courses Business Intelligence and Big Data & Advance Decision Analytics, we did an analysis of analytics job market by cities in India. The commercial aspect of such study is (i) Helps institute administration understand the emerging cities closer to their institute for analytics jobs which in turn help them drive better placements and industry connect (ii) Help an analytics aspirant student in decision making of college selection. The closer the college is to these emerging cities, the easier it will be for him to get connected to the analytics companies. (iii) Help the job portal capitalize on the analytics market

The data capture was done from the 3 job portals i.e Naukri.com, Shine.com and Monster.com. These three were called the top 3 portals by World Blaze.in. The keyword “analytics” was used to filter out the jobs from these portals and then the cities were captured. Monster.com was rejected from the analysis due to unavailability of the comprehensive “Location Filter” feature. The capture was done on 25th Aug 2015 at 9.45pm with a tolerance of plus minus 2 mins. The freshness filter for Naukri.com was “Last 30 days” but for Shine.com it was not applicable due to unavailability of the feature. This limitation would not hamper the results much as the main objective was not to compare the availability of Jobs on Naukri.com versus Shine.com

View the infographic here.

The infographics revealed some interesting insights and led to some recommendations.

  • 47% of the Analytics Job market is in Bengaluru and Delhi NCR Region.
  • Close to 28000 analytics related jobs are at Naukri compared to 4000 jobs at Shine which is 2nd biggest portal after Naukri. Monster.com has 2000+ odd jobs
  • Cities like Jaipur, Ahmedabad, Chandigarh and Indore have also entered the league of providing analytics jobs.
  • Institutes located in these cities have a strategy advantage over their rival institutes
  • Students who are planning to apply into analytics courses should match the institute location with these cities in order to have better exposure during the course
  • com beating the competitors by very high margins can gain more strategy advantage by creating sub portal for Analytics to cater to needs of the applicants needs especially. Their already existing e-learning, certifications and resume making feature would strength such a move

These sequels to our study are believed to be the concomitant of the following grounds:

  • The sphere of analytics is mostly congested by the IT industry and Bangalore and Delhi are expeditiously developing themselves in this discipline. Ergo, the jobs are bound to be concentrated in this region but a staggering figure of 47% needs a deeper inspection.
  • Considering the fact that this job would necessarily be a blue collar job which roughly are the 13% of the total job market of 15 lac a year, resulting in roughly around 10% of the blue collar jobs. This is clearly an outcome of the decision making bodies of industries and companies relying more and more on analytics than hunch.
  • Tier 2 an tier 3 cities have been growing as favourites of technological start ups and as a breeding ground for skilled individuals. Analytics being a new entrant in the industry has attracted appreciable minds into the arena as new companies or new division in companies.

The opportunities are numerous and we may still be at the edge of the new mountain that has been discovered. We see already analytics being revolutionised into Big Data, Quantum computing, machine learning and artificial intelligence. The technological barriers are being liquidated as we speak. The managerial implications only points towards an upward trajectory of the society and the business.

References:


Written By

Sahil Garg |Manu Jain
2nd Year PGDM Marketing, IMT Ghaziabad
email id: sgarg.d89@gmail.com | manujain3710@gmail.com

About the writers:

Sahil and I are 2nd year MBA students from IMT Ghaziabad. We are also the co-founders of Admito.in, which aims to help student in his/her college selection process. Currently Admito.in is incubated in IMT Ghaizabad

(Visited 561 times, 2 visits today)

The post Analytics Cities of India appeared first on Analytics India Magazine.


Analytics usage in emerging markets

$
0
0

SGanesh

In the last two decades, investments made in digitalization and transaction automation have enabled organizations to evolve significantly in their ability to capture raw customer behaviour data. This combined with massive increase in computing power and data storage has fuelled the growth of analytics industry, now worth more than $50 billion globally.

However, we find that the adoption of analytics is less significant in emerging markets of South Asia, Middle East and Africa compared to the more mature markets of North America and Western Europe. This article presents some key findings of a survey done by dun & bradstreet to assess the adoption of analytics in emerging markets and the emerging trends.

Dun & Bradstreet Survey

Dun & Bradstreet had carried out a survey to assess the usage of analytics in the banking industry as banks have traditionally been the biggest user of analytics. The survey team contacted business and technology decision makers across 250 banks and received 119 responses. Given below are some of the key findings:

SGanesh1Adoption of predictive analytics is low

Only one third of the banks confirmed using predictive analytics in their organization. Even among the large banks (> $ 5 billion assets), the adoption rate is less than 50%. In absence of analytical models, most of the banks use well-defined business rules for making lending decisions. Also, this is main form of decision in Islamic banking compared to traditional banking.

SGanesh2Analytics usage is limited to very few areas

Banks are using analytics in very limited areas with main focus on meeting regulatory requirement and risk management. The use of analytics for the purpose of marketing, pricing, customer loyalty and profitability management is very minimal and practiced by few very large banks only. Investments in social media and web analytics are at a very nascent stage.

SGanesh3Reasons for Low Adoption

Nearly half of the banks not using analytics cited “insufficient data” as the primary reason. This is largely due to lack of maturity in IT systems to store historical information in digital format, while one third of the banks are satisfied with current process of relying on business rules instead of analytics. However, most of the banks believe that the adoption will increase in next 2 years with recent investments in transaction automation and data warehousing solutions.

SGanesh3Analytics journey has just begun in these markets

More than 80% of the banks using predictive analytical models in their business decision making process reported that these models were developed within last two years. The main drivers for analytics were stricter compliance requirement from central banks, growing uncertainty in financial markets and need for deploying capital more efficiently. However, banks reported that analytics has also helped them in improving speed and accuracy in their lending decisions.

SGanesh3Reliance on third party service providers

Majority of banks have partnered with third party service providers for development of analytics solutions instead of building in-house analytics teams. The key reasons are readily available analytics talent, existing infrastructure of service providers and their experience in developing similar solutions for other markets. However, the large banks have either already invested or plan to invest in building in house analytics infrastructure and capability.

Does it pay to invest in analytics?

As part of this study, dun & bradstreet also cSGanesh3ompared the performance of analytical models with commonly used business rules in taking credit decisions. It was found that analytical models outperformed the best business rules by 24% in their ability to predict credit worthiness of a new customer. In a specific case study, the analytical models delivered an increase of 8% in approval rates with a decline of 1.1% in customer delinquencies adding around $ 10 million on a portfolio of $ 1 billion.

Summing Up

It is evident that currently the adoption of analytics, both in terms of width and depth is fairly limited in the emerging markets compared to the mature markets. Availability of sufficient data of acceptable quality and appetite for investments in analytics infrastructure have been the traditional hurdles. However the investments made in core transactional systems and customer management channels are producing a lot of data about customer behaviour and preferences, which can be leveraged by organizations to understand consumer needs and customize their product and service offerings accordingly to enhance customer experience and loyalty, while mitigating risk. Substantial reduction in data storage costs and analytics tool and technologies has also made development and implementation of analytics solutions more affordable.

Though we still witness some reluctance in using analytics instead of business rules or manual judgement in customer decisions, especially in the higher levels of management. This may be because a generation ago most organizations lived in a data starved environment which resulted in most successful managers of the time relying on experience and intuition to take decisions. We believe that this is likely to change as they start realizing the benefits on their initial investment in analytics to justify higher investments for greater adoption. The use of analytics in emerging market has just begun and we see tremendous growth opportunities in these markets.

(Visited 181 times, 4 visits today)

The post Analytics usage in emerging markets appeared first on Analytics India Magazine.

Top 10 Analytics Training Institutes in India – Ranking 2015

$
0
0

A data scientist needs to have skillsets in a wider horizon and is expected to not only have knowledge in statistics and coding but also should be good in visualization and storytelling. Data science is a constantly growing field with new tools and techniques being introduced and older ones getting obsolete frequently.

The demand for such trained professionals outgrow the training institutions in both quality and quantity. Many boutique-training institutions are taking a note and bringing their own offerings in this field. But how many of these courses are relevant and meets the expectation of the industry.

This is our annual ranking of top 10 analytics training institutes in India. Here we bring to you the top analytics education institutions in the country by meticulously going through the institutes and their offerings. The institutes are ranked on the following 5 parameters, just like each year course content, pedagogy, external collaborations, faculty and addition features like Virtual Labs, Placement Assistance, Events etc. This year we got more than 15 institutes taking part in this ranking. We take into account student as well experts feedback to carve out this cherry-picked ranking of just 10 institutes.

1. AnalytixLabs

Analytixlabs

Mode of delivery: Online & Classroom

Headquarter city: Delhi/NCR

Cities operating in: Global (through online and onsite training)

Flagship program: Data Science with SAS and R, Certified Big Data Analyst

Year instituted in: 2011

alabs1

AnalytixLabs is a capability building and training solutions firm led by McKinsey, IIM, ISB and IIT alumni with deep industry experience and a flair for coaching. ALABS pioneers in high quality online and classroom training since 2011. Their USP is industry focused and job-oriented courses along with a high degree of personal attention from the faculty. They offer a wide array of courses in Data Science, Big Data Analytics and Data visualization along with global certifications. Apart from individual professional training, they have worked with prestigious clients, like American Express, BlackRock, EXL Services, Jabong, Snapdeal, Times Group, Tech-Mahindra and even Indian Army.

  • Team together has over 50 years of rich experience in Analytics & Consulting and the trainers are handpicked from leading firms like McKinsey, Deloitte, Genpact, Fidelity and Facebook.
  • Case study based modules crafted by experts based on real life business scenarios ensure that participants learn practical applications and get flavors of various analytics problems, thereby steepening their learning curve.
  • Dedicated placement cell and counselling by a panel of experienced faculty members who have had first-hand experience in analytics recruitments.
  • Suitable candidates are also offered internship opportunities within the in-house R&D wing, which is focused on upcoming advanced analytics and big data solutions.

Read Interview with Sumeet Bansal, CEO & Co-founder at AnalytixLabs

2. Edvancer

edvancerMode of delivery: Online

Headquarter city: Mumbai

Cities operating in: Online and hence everywhere

Flagship program: Certified Business Analytics Professional

Year instituted in: 2013

edvancer

Edvancer has been providing analytics, data science & big data training globally for the last 2 years and has trained thousands of people in this time period. It is an IIM-IIT alumni venture which provides the most practical, industry focused, hands-on, cost effective courses which enable students to gain skills needed by industry. Edvancer has been awarded the Big Data Training Institute of 2015 by Silicon India Magazine.

Edvancer offers courses in Business Analytics, R, SAS, Hadoop & Big Data, Text Analytics, Banking Analytics, Python for Analytics etc. Edvancer’s courses are designed & delivered by industry experts who are rigorously evaluated to select the best experts to create and deliver the best courses. Satisfaction levels with Edvancer’s faculty are very high and is a big differentiating factor for the institute. Edvancer conducts trainings through live, instructor led, online classes. These virtual classrooms provide complete interaction with the trainers and other participants and work just like a normal class. They use a case-study based methodology within their courses with a focus on working hands-on on the concepts. Some of the courses are also provided through a ‘Self-paced + Faculty support’ pedagogy where the trainees can learn through recorded videos at their own time & pace and can get faculty help for any doubts or queries. Edvancer offers placement assistance to the students and in the past several of their students have got interview opportunities and placed with various firms like Hansa Cequity, TCS, ICICI Lombard, Smartcube, Eclerx, Atos Origin, Capgemini, Accenture etc.

3. International School of Engineering (INSOFE)

insofe

Mode of delivery: Classroom

Headquarter city: Hyderabad

Cities operating in: Hyderabad

Flagship program: Certificate in Engineering Excellence (CPEE) – Big Data Analytics and Optimization

Year instituted in: 2011

International School of Engineering (INSOFE) has been conducting world-class classroom based training in Big Data Analytics and Optimization for over 4 years, having 600+ alumni. Its certificate program is certified for its quality of content, pedagogy and assessment by the Language Technologies Institute (LTI) in the School of Computer Science (ranked #1 in the world by US News and World Report) at Carnegie Mellon University (CMU).

This program is also listed #3 (#2 among academic institutions) in the world by CIO.com for “Big Data Certifications That Pay Off”. INSOFE is flanked by Columbia University and Stanford University in this list.

INSOFE’s flagship certificate program, CPEE (Certificate Program in Engineering Excellence), has scored another first by being the first certificate program in the world to offer complete tuition waiver and paid internships. In every batch, INSOFE offers this fellowship to a few people with work experience ranging from 0-5 years, after due process. This certificate program is weekends-only and spans a duration of ~6 months.

INSOFE’s focus on high quality applied education has led to many companies actively engaging them for their corporate training and Centres of Excellence building needs. INSOFE has conducted such trainings for organizations in India, US, UK and Middle East.

4. Imarticus Learning

Analytics-Banner

Established in 2012, Imarticus is India’s leading Analytics professional education company, which assists individuals and firms in meeting their human capital and skillset requirements through our range of bespoke training programs. Imarticus is headquartered in Mumbai, and has presence in over 10+ cities in India.

  • Experienced Educators: Having educated over 10,000 individuals, Imarticus is in a unique position to understand the learning needs of aspirants and design it’s training to be stimulating & relevant. Imarticus has a range of customized delivery methods such as classroom training, elearning, workshops and seminars that are delivered globally and are managed by a fully integrated learning management and governance system.
  • Coverage: Imarticus has training capability across various analytics techniques and tools such as R, SAS, Python, Big Data, Hadoop, Data Visualization, Tableau and more. Imarticus is led by senior professionals from universities such as Columbia, MIT, Harvard and INSEAD, with 150+ years of combined experience in the Technology, Analytics and Financial Services domain. In addition, Imarticus has over 10+ dedicated analytics faculty and over 30+ empaneled faculty members in the field of Analytics.
  • Corporate Connect: Imarticus is the preferred sourcing & corporate training delivery partner for over 80 firms, which include leading Global & Domestic Banks, Consulting, KPO’s, Technology & Analytics firms.

5. Edureka

edureka-logoMode of Delivery: Online Live Interactive Classes

Headquarters: Bangalore

Cities operating in: Online Delivery

Year instituted in: 2011

Edureka is India’s fastest growing online education marketplace for live, interactive courses in technology and business verticals. Edureka currently offers over 75 courses ranging from big data and analytics, to mobile programing, to digital marketing and professional certifications; all taught by top industry experts.

Edureka-Team-ImageEdureka follows a highly effective delivery model of instructor-led live online classes with 24×7 support and free lifetime access to all the course content. This content resides in a state-of-the-art Learning Management System (LMS).

Edureka’s course content is up-to-date with industry requirements and is aimed at students and professionals who want to up-skill themselves. Many of these learners are interested in working in the analytics industry and are keen to enhance their technical skills with exposure to cutting-edge practices.

According to NASSCOM, analytics market in India is expected to double to $2.3 billion by FY18. To this end, Edureka is bridging the talent gap through courses on new technologies – particularly in the fields of Big Data and Analytics. These courses are helping professionals gain the right skills and knowledge required to build a successful career in the analytics industry.

Some of the popular analytics courses at Edureka include Big Data & Hadoop, Mastering Data Analytics with R, Data Science, Data Visualisation, Hadoop Administration, Apache Spark and Scala and Digital Media Analytics.

6. IMS Proschool


1368766567phpyBzZfeMode of delivery
: Classroom and Live Virtual Classroom (webex platform)

Headquarter city: Mumbai

Cities operating in: Mumbai, Navi Mumbai, New Delhi, Bangalore, Chennai, Hyderabad, Pune, Bhubaneshwar

Flagship program: NSE India Certified Business Analytics Program

Year instituted in: 2014

IMS Proschool, in association with NSE India (India’s largest Certification body in Finance) offers Business Analytics Certification Program. Proschool along with the Parent company – IMS Learning Resources, has trained more than 300,000 candidates for different competitive exams and various professionals courses in Finance, Accounts & Analytics etc.

Proschool has also trained more than 16,000 employees of different BFSI companies such as ICICI Group, State Bank of India, Citibank, Kotak Group, etc.

IMS Proschool is a partner of NSDC – National Skill Development Corporation, an initiative of Union Ministry of Finance to provide skill development training to the youth.

Designing and delivering a Business Analytics (BA) Training Program is very challenging since it is a cross functional area that requires understanding of statistical techniques, data extraction and management with IT tools as well as the domain knowledge where the analytics may be used. At the same time the trainees also have varied backgrounds ranging from IT to management or commerce graduates with no work experience.

IMS Proschool Program has evolved to achieve a fine balance between these divergent and vast areas. We believe the program now blends the right amount of stats, IT and domain and can be understood by most trainees even with different backgrounds.

7. Manipal Pro Learn

Manipal Pro LearnMode of delivery: Online – Instructor Led

Headquarter City: Bangalore, India

Cities Operating in: All India

Flagship Program: Big Data Analytics using Hadoop

Year Instituted in: 2014

The Big Data Analytics course using Hadoop from Manipal ProLearn is designed to provide a comprehensive learning experience to those who intend to create a career in analytics. It is targeted at software professionals, project managers, testing professionals and fresh graduates. The learners are trained through multiple mode such as video lectures, reading materials, online-practice sessions, case studies and webinars from subject matter experts. The program is of 120 hours duration.

Manipal ProLearn is the online marketplace for certifications from Manipal Global Education Services. The certification programs aim to bridge the skill gap prevailing in emerging areas of analytics, digital marketing and IT.

8. IVY Pro School

ivyproMode of delivery: classroom/ live online ILT/ LMS

Headquarter city: Kolkata

Cities operating in: Kolkata., Bangalore, New Delhi, shortly opening in Pune

Flagship program: Business Analytics Programme

Year instituted in: 2007

Ivy® Professional School (Ivy) is a pioneer in the Big Data Analytics and Data Science training in the country since its inception in 2007.

Course Content:

Ivy’s programmes on Business Analytics, Big Data, Data Visualization and Advanced Data Scientist have become benchmark courses for several analytics companies for training and skill development.

Besides the core courses, Ivy offers Live Projects / Internships Backed Comprehensive Short-term Course Packages for Individuals, Problem Solving workshops and career enhancing workshops in the form of Communication Skills, Resume Building, Interview Sessions etc. to its students.

Achievements:

  • 10,000+ trained from 10+ countries, 50+ corporates and 100+ colleges (including IIMs, IITs, ISIs, etc.).
  • Conducted Risk Analytics batches in US for large analytics firms
  • Free Webinars on Cutting Edge Analytics Concepts / Tools

Industry Collaborations

  • Ivy helps Analytics firm in selection and training of candidates. These candidates are absorbed after assessment by the firm. (In the past such batches have been conducted for companies like Mu Sigma, Genpact, Affine Analytics, etc)
  • Ivy is the official training partner of Genpact, HSBC, eBay/Paypal, ICRA Online, ITC Ltd., Capgemini, Cognizant,mJunction, Lexmark Inc., etc

Placement Assistance

  • 65+ analytics companies have recruited Ivy’s candidates through its dedicated Career Center team.
  • Life-Time Access to Ivy’s Analytics Exclusive Job Portal

9. NIVT

NIVT banner

Mode of delivery: Online & Classroom (Both)

Headquarter city: Kolkata

Cities operating in: Kolkata

Flagship program: Different Skill Development training program under Skill Development Initiative Scheme, Govt. Of India.

Year instituted in: 2003

NIVT® -the training brand of Novel Research and Development India (P) Ltd.” Incepted in the year of 2003 based in SDF Building, Webel Electronics Complex, Salt Lake City, Sector-V, Kolkata, WB, India is the premier training provider in the field of Business Analytics, Data Science and Information system management.

NIVT is an innovative concept of imparting technology training to young professionals in niche areas starting from beginner’s courses to Data Analytics, Business Intelligence tool and other emerging technologies. We aim to fill up the huge ‘Skill Gap’ in the analytics industry across pan India. Our courses in business analytics are designed to embed business orientation, statistical and data mining skills to enable candidates to apply business analytical techniques in their work areas immediately after completion of the courses.

NIVT focuses on offering project based Analytics training on Market Research & Retail Analytics, Financial Analytics, Clinical Analytics; Social Media & Web Analytics, HR analytics, Fraud Analytics etc. using the emerging technologies like Base SAS, Advance SAS, SAS Analyst Application, R Programming, SPSS, Advance excel, Big Data Hadoop, Python, Tableau etc.

We have a proven track record of placement in different organizations. The Placement Cell arranges interviews for students by the prospective employers, and monitors on-job training. Majority of students get proper and satisfying placement.

10. Orange Tree Global

OTG LogoMode of delivery: Both Classroom and Online

Headquarter city: Kolkata

Cities operating in: Kolkata, Mumbai, Pune, Gurgaon

Flagship program: BIBA (Business Intelligence and Business Analytics Program)

Year instituted in: 2010

OrangeTree Global is a leading Business Analytics and Business Intelligence Training organization with Centers across India. The organization focuses on Business Intelligence tools like SAS, R, SPSS and VBA. The case study centric approach ensures that students and professionals learn and master the application of Analytical techniques on Business Intelligence Tools. With regional offices across Mumbai, Pune and Kolkata the company has been providing analytics training to some of the largest FMCG, Financial Institutions, Media Houses, prestigious educational institutions and IT companies in India for more than 5 years now. Some of its clients comprise ITC Limited, Reliance, IIT Kharagpur, Yes Bank, St. Xavier’s Mumbai.

Training is provided through live classrooms sessions and online and are aimed at working professionals and smart fresh graduates who aspire to join the Analytics industry. The full program spans over weeks and covers modules on Business Analytics taught on Business Intelligence platforms such as SAS, R, SPSS and VBA. Tableau.

Students who complete the course successfully are then required to sit for an in-house certification examination. The answer scripts are circulated amongst the different centres and graded by different faculty members. The certificate issued has been named the BIBA (Business Intelligence and Business Analytics) certification and it is now a widely accepted certificate.

(Visited 6,329 times, 111 visits today)

The post Top 10 Analytics Training Institutes in India – Ranking 2015 appeared first on Analytics India Magazine.

Top 10 Analytics Courses in India – Ranking 2015

$
0
0

Rankingannouncement_horizontal

A good data scientist should have a mix of knowledge in statistics and coding with an add-on of visualization and storytelling. There are several tools available in the market that caters to the field of analytics. To build up the right skillset it is imperative that a professional gets the right resources. It’s been our constant endeavor to bring to you the best in the field of analytics. Our Annual ranking is a step in this direction.

Through our Annual ranking we bring to you the top analytics education institutions in the country by meticulously going through the institutes and their offerings. It is a complex process based on research to get the correct information about the required parameters and then the ability to use the information to present you the right outcome.

Please note that this is a courses ranking by B-Schools in the country. We publish a separate Analytics training institutes ranking which is completely separate from this ranking. We acknowledge that slotting the training institutes with the B-School providing analytics courses in the same list is not right comparison. Thus, these are 2 separate and unique rankings. More importantly, we do not intend to rank these B-School in totality but just a specific analytics course by them.

The institutes are ranked on the following parameters:

  • Course content
  • Pedagogy
  • External collaborations
  • Faculty
  • Course Delivery/Virtual Labs
  • Placement Assistance,
  • Events etc.

This year we got more than 15 B-Schools taking part in this ranking. We take into account students as well experts feedback to carve out this cherry-picked ranking of just 10 courses.

1. Post Graduate Program in Business Analytics – Great Lakes Institute of Management

Great Lakes Chennai Campus original

The Great Lakes Business Analytics program has been created in collaboration with corporate partners and senior professionals in analytics industry. The program has delivered around 1,75,000+ learning hours and the schedule and delivery is designed keeping in mind the time constraints and learning requirements of working professionals.

IMG_1941The Great Lakes Post Graduate Program in Business Analytics equips candidates with the skill sets required for managerial, techno-functional roles in analytics. Its curriculum has been uniquely designed to meet these features and provides exposure to relevant tools like SAS, R & Tableau. The PGPBA program provides the right exposure to real world applications, ensuring that the professionals are equipped to apply their learning in the industry. The industry oriented pedagogy, hands-on exposure and highly acclaimed faculty help the candidates gain analytics competencies thereby preparing them for business and techno-functional roles in analytics.

LOCATION

The PGPBA program is currently being offered across three locations in the country: Gurgaon, Chennai, Bangalore.

IMG_1887CLASSROOM LEARNING

The program consists 230 hours of classroom sessions + 110 hours of online sessions delivered by Great Lakes faculties and industry professionals from the field of analytics. This ensures that the program imbibes Great Lakes academic elegance and industry’s business relevance, thereby providing the candidates with a remarkable learning experience.

ONLINE – LEARNING MANAGEMENT SYSTEM

All candidates have access to the online LMS that hosts content (classroom recording, discussions forums, assignments, reading material) and live webinar to enable the candidates continue their learning during off campus. The LMS provided and innovative learning environment that encourages collaborative approach between the candidates thus paving the way for maximizing learning effectiveness.

IMG_1882EXPERIENTIAL LEARNING

This program is designed to transform candidates to business ready analytics professionals through hands on experiential learning on relevant tools. This is achieved through an experiential learning format wherein participants practice exercises and assignments on software package such as SAS, R and Tableau.

CAPSTONE PROJECT

All candidates would be pursuing an industry project in the field of Business Analytics. The project is mentored and jointly evaluated by faculty from Great Lakes and Industry leaders. The project is presented to the faculty board as part of the requirement for successful completion of the program.

2. Certificate Programme on Business Analytics and Intelligence – IIM Bangalore

300px-IIM_Bangalore_Logo.svgThe course is designed to provide in-depth knowledge of handling data and Business Analytics’ tools that can be used for problem solving and decision making using real case studies.

The 1 year long duration program consists of eight modules and a project. The duration of each module is usually 5-6 days except for module 2 (2 days) and module 7 (2 days).

Students are expected to do a group project as part of this course based on a real-life problem/data. The project pre-work should start around October and should roll out by January. It will be supervised by an IIMB faculty member and must be wrapped by May with a project report submission. The Institute encourages students to publish cases studies based on their course project.

At the end of the course, the participants will be able to:

  • Understand the emergence of business analytics as a competitive strategy.
  • Understand the foundations of data science; the role of descriptive, predictive and prescriptive analytics in firms.
  • Analyze data using statistical and data mining techniques and understand relationships between the underlying business processes of an organization.
  • Learn data visualization and storytelling through data.
  • Learn decision-making tools / Operations Research techniques.
  • Use advanced analytical tools to analyse complex problems under uncertainty.
  • Manage business processes using analytical and management tools.
  • Use analytics in customer requirement analysis, general management, marketing, finance, operations and supply chain management.
  • Learn analytics through case studies published by IIMB at the Harvard Business Publishing
  • Understand sources of Big Data and the technologies and algorithms for analyzing big data for inferences. Ability to analyze unstructured data such as social media data and machine generated data.

3. Executive Program in Business Analytics (EPBA) – MISB Bocconi

MISB (1)

One of Europe’s top b-schools, SDA Bocconi, and Jigsaw Academy, launched a 10-month Executive Program in Business Analytics (EPBA) for professionals earlier this year. This was a unique combination of management principles backed by analytics training.

SDA Bocconi is currently ranked at #7 in the world for its MBA program, and Jigsaw Academy is ranked #1 in India for its analytics training courses. The program will be conducted at Bocconi University’s campus in Mumbai. Upon completion, the participants will receive certification in business analytics from the SDA Bocconi School of Management.

The course provides a deep understanding on all relevant disciplines of business analytics, including statistics, machine learning, time series, R, SAS, Big Data (Pig, Hive, Sqoop, Flume, HBASE, SPARK and Oozie), visualization, text mining, web analytics and digital marketing. In addition, it also focuses on its application across sectors and functions including Telecom, Banks, Retail, Healthcare and Insurance as well as areas such as Finance, Marketing, and Operations.

The programme involves more than 280 hours of training, including 120 hours of in-person training held over six three-day modules at the MISB Bocconi campus in Mumbai. In the interim, Jigsaw Academy also conducts 24 live online classes for a total of 60 hours, which participants can attend from any convenient location. In addition to the live online and in-person classes, participants will also have access to over 100 hours of pre-recorded video lectures on data science and big data analytics for 12 months.

4. Post Graduate Program in Business Analytics – Praxis Business School

praxis logoThe Praxis program is targeted at candidates who are serious about carving a career in analytics for themselves – and are willing to commit a full year to learning. These are candidates who wish to see themselves grow as successful Data Scientists. Praxis has a fairly rigorous selection process and admits only those who demonstrate strong analytical skills and an interest in numbers and problem solving.

The Course aims at equipping students with the tools, techniques and skills to enable a seamless absorption into the domain of Analytics and grow into the roles of Data Scientists. Praxis thus focuses on offering its students a comprehensive analytics experience, a deep-dive that ensures extensive coverage, rigor and hands-on lab-work.

Pedagogy

Business Analytics lies at the intersection of three key disciplines, namely Statistics, Programming and the targeted Business Domain and the 9 month program at Praxis is designed to address all three in significant depth.

The backbone of analytics is the theory of statistics in general and data mining in particular and these two key areas as two different subjects across two consecutive semesters to ensure that students have the time to imbibe and absorb the nuances of theory and have a strong foundation to build upon. Both these subjects have ‘lab’ sessions where the students use R to actually try out the theory on the basis of publicly available datasets.

5. Post Graduate Program In Business Analytics & Big Data – Aegis Aschool of Business

aegis logoPost Graduate Program In Business Analytics & Big Data brings together the current software content, real-world industry experiences, hands on exposure on various Big Data tools at Big Data Product Factory & IBM Business Analytics and Cloud Computing Lab for the participants.

The course curriculum is designed & developed by IBM’s designated subject matter experts & Industry experts for the participants & data science enthusiasts that is jointly delivered by IBM’s subject matter experts and & Industry experts.

The curriculum caters to the various skill requirements of organizations across the world including eCommerce, Telecom, Banking, Computer Services, Education, Healthcare, Insurance, Manufacturing, Retail, Automobile etc.

A wide range of core and elective courses provides the participants the freedom to design the program suiting to their and industry needs.

External Collaborations:

In 2015 Aegis has joined hands with IBM to offer high end courses in the field of Business Anlytics, Big Data, Cloud Computing and Mobility.

IBM and Aegis have collaborated to setup an IBM Business Analytics and IBM Cloud Computing Lab in MTNL’s world-class infrastructure in Powai, Mumbai, to help students and faculty members to enhance their skills in areas of Business Anlytics, Big Data, Cloud Computing and Mobility.

MTNl, a leading Govt of Indian telecom service provider, is Aegis Infrastructure partner in Mumbai.

Aegis’ Post Graduate Program in Business Analytics and Big Data, PGP (BA & BB) is India’s first high end data science program designed and delivered by Aegis School of Business & Telecommunication in association with IBM to train the new generation of data-savvy professionals.

6. Post Graduate Certificate in Predictive Business Analytics – Bridge School of Management

bridgesomBRIDGE School of Management is a flagship business school launched via a joint venture between HT Media Ltd. & Apollo Global, Inc. (USA). Apollo Global (www.apolloglobal.us) is one of the world’s leading higher education providing companies.

The certificate program has been specially created for India by academicians from Northwestern University and top industry experts using real-world problems and situations. The Northwestern and Bridge School initiative combines online content developed and taught by Northwestern faculty with weekly in-person sessions led by local specialist faculty at the Bridge School’s learning centers.

Program Objectives

  1. Apply analytics tools to real-world business contexts for improved decision making
  2. Assess the strengths and limitations of analytics and predictive modeling techniques for different business applications and varying data conditions
  3. Acquire hands-on experience working with leading statistical tools and software packages (such as R) in predictive modeling and the visual analysis of results
  4. Effectively communicate the actionable insights stemming from analytical work to multiple stakeholders
  5. Strategically navigate technology tools and trends to solve big data and analytics problems
  6. Manage data strategies and analytical projects.

7. Certificate Program in Big Data and Analytics (BDAP) – SP Jain School of Global Management

sp jainThe course is being offered at S P Jain’s spanking new campus at Lower Parel, which boasts of State of the art facilities, in the heart of the city’s business center.

BDAP is designed to explore, analyze and unravel the complex, unstructured data-driven world. The program kicks of with 10 core courses that build a strong foundation for the second stage of the program, which incorporates more in-depth and application-based learning. Given the need for specialist knowledge, it provides a range of courses in topics like data mining, machine learning, visualization techniques, predictive modeling, and statistics.

The programme content builds on basic concepts, teaches tools and technologies that are currently prevalent in industry and progresses to cutting edge-topics like machine learning and Natural Language Processing.

On completion of the program students would have learned to apply quantitative modeling and data analysis techniques to solve real world business problems, successfully present results using data visualization techniques, demonstrate knowledge of statistical data analysis techniques utilized in business decision-making, apply principles of Data Science to the analysis of business problems, use data mining software to solve real-world problems and employ cutting edge tools and technologies to analyze Big Data.

The program is delivered by a faculty that is an equal mix of academicians and industry practitioners with a key proportion of overseas instructors thus lending the course a global perspective.

8. 2-year Full time PGDM Programme with Analytics Specialization – Narsee Monjee Institute of Management Studies

narsee monjeeNMIMS, Bangalore offers industry leading specialization in Analytics for its PGDM programme. Students in the second year of the programme can opt for this specialization. It also offers Marketing, Finance, Operations and HR as other specializations. The second batch of this specialization is running now. The first batch was well received by industry and the students are absorbed in organizations like Citibank, Infosys, mu-sigma, GENPACT, iGate, Netapp, Fidelity etc.

Through this specialization, NMIMS trying to educate Analytics professionals who are well equipped with Management functions and Data Science. The coverage of the specialization is extensive as it got Tools, Techniques, Functional and Industry related courses.

Course Content

The Analytics specialization stream consists of twelve (12) courses (and a workshop) spread across 3 trimesters in the 2nd year of the PGDM program. It is expected to cover the knowledge areas expected of an Analytics professional viz. tools, techniques and functions. Additionally, a course titled ‘Business Analytics for Decision Making’ is compulsory for all students in the institute.

Pedagogy

The programme is conducted live in the class room at the campus at Bangalore. The delivery consists of classroom lectures and interactions, case discussions, workshops and analysis of live industry problems. The institute got license to SAS software and hence, most of the data analysis and modelling is conducted on this platform.

9. Executive Program in Business Analytics and Business Intelligence – IIM Ranchi

IIM ranchi“Executive Program in business analytics and business intelligence (Saturday to next Sunday with one week leave)” is specially designed to provide inputs which will equip the participants with analytical tools and prepare them for corporate roles in analytics-based consulting.

These inputs will provide a basis for the participants to channelize their analytical thinking in appropriate directions, besides, enhancing knowledge. The skills so acquired may be effectively utilized in their day-to-day work and thereby promoting the quality of business decisions.

Objectives of the Programme

  1. To enable the participants to understand and use the tools and techniques for business analytics and business intelligence.
  2. To enable the participants to make use of large volume of data for meaningful business decisions and strategy
  3. To impart hands-on-experience with various softwares, like, (i) R, (ii) SAS (iii) Python (iv) SPSS

Pedagogy of the Programme

The participants will learn the concepts and implications of business analytics & business intelligence through class room lectures, interactive discussions, case studies and hands-on-experience. Both conceptual and practical sides will be addressed.

Participants Profile

The course is suitable for those with analytical aptitude and would like to start new career in analytics. The course is also appropriate for those who are working in business analytics and business intelligence to enhance their knowledge and skill.

10. PGDM with Specialization in Business Intelligence and Big data – IMT Ghaziabad

imt_logoThis is a unique course which prepares you for the world of work in analytics in companies. Students having opted for this course in the previous years have found placement offers from leading companies, the designations include Data analyst, Business development Manager, and Business Analyst and research analyst. The course gives you a blend of industry knowledge, concepts and experiential learning through collaborative teaching by industry experts. Take the first step in joining the course; we will then help you to complete the journey into a person well-versed with the art and science of analytics.

Pedagogy

The pedagogy will be a mix of lectures, experience sharing, real life case discussion, assignments and industry/research based projects. The course is focused on strategic issues with cases as the primary vehicle for learning. In addition to the reading materials, additional readings and cases will be distributed in the class from time to time. Students are also expected to prepare and analyze all the cases as class participation is very important. There are four main pillars in the course pedagogy, namely, (a) lectures-cum-PPTs to share the conceptual frameworks; (b) experience sharing through collaborative teaching by industry experts; (c) hands-on Statistica Data mining tools, computer-lab based; and (d) case studies of leading organizations selected from Harvard Cases and other sources. The course requires a high degree of interactions in the class on part of the students and feedback on their hands-on work is provided by industry experts.

View & Download the complete report on Slideshare

Top 10 Analytics Courses in India 2015
Title: Top 10 Analytics Courses in India 2015 (63 clicks)
Caption:
Filename: top-10-analytics-courses-in-india-2015.pdf
Size: 3 MB

Note: There is a poll embedded within this post, please visit the site to participate in this post's poll.
(Visited 2,971 times, 11 visits today)

The post Top 10 Analytics Courses in India – Ranking 2015 appeared first on Analytics India Magazine.

Top 10 data Scientists in India – 2015

$
0
0

Top 10 Data Scientists in India

Data scientist is a rare breed and a well celebrated one. Middle of this year, we took it upon us to identify the top data scientists in the country. The initiative was asked for by many of our avid readers.

I personally believed that, given our inroads in the analytics ecosystem of the country, this initiative would essentially be an easier take. I was wrong, it took us a good 4 months to carve out the below list. The list is a result of our survey and submissions from various organizations, in depth research into the ecosystem and feedback from various leaders and experts.

We believe that a top data scientist should have the following in some combination: – A right pedigree and showcased achievements in applying data science in their respective domain and industry, an Individual contributor, hands-on coder, Hacker of Big Data/ analytics Tools & techniques, good communicator with ability to convince multiple stakeholders through data insights, Patent/ Technical publications author etc.

So, here it is, our cherry-picked, meticulously curated list of top 10 data scientists in India for this year.

Anand S

anand sAnand is the Chief Data Scientist at Gramener.com. He has advised and designed IT systems for organizations such as the Citigroup, Honda, IBM, Target, etc.

Anand and his team explore insights from data and communicates these as visual stories. Anand also builds the Gramener Visualisation Server — Gramener’s flagship product.

Anand has an MBA from IIM Bangalore and a B.Tech from IIT Madras. He has worked at IBM, Lehman Brothers, The Boston Consulting Group and Infosys Consulting.

Chandra Mouli Kotta Kota

chandraChandra Mouli Kotta Kota is a Analytics Specialist and Data Scientist with a decade long experience after completing his education from IIT-Madras in 2006. He has got rich Marketing Analytics experience which he has attained during his tenure with prestigious companies like McKinsey, Genpact and erstwhile Citigroup Services. With his analytical rigour he has helped various Banking & Financial Services, Media, Telecom and Retail clients across the globe.

Chandra has worked in various domains, like Marketing Analytics (CSI, CLM & Pricing), Risk Analytics and Operation Analytics and has hands-on expertise in Big data and Multivariate analytical techniques including classical & machine learning algorithms, Acquisition, Response, LTV Models, Attrition and MROI Models, Pricing Models and Credit Risk Models (PD Models for Credit Cards, Consumer Loans and Insurance Portfolios). A master of various statistical and analytics platforms, like SAS, R, Python, SPSS Modeller and Hadoop.

He is now the Chief Data Scientist at AnalytixLabs, where he has trained and coached several client teams and 1000+ professionals on data science and advanced analytics along with on job implementation. He is also heading the Research wing of AnalytixLabs where he is constantly engaged into devising and improvising the integrated Date Science and Big data solutions.

Hindol Basu

hindolHindol, is the head of the Analytics Consulting practice at Tata Industries (Consumer Analytics Division), he brings in about 13 years of analytics consulting experience spanning across multiple industry verticals and markets. Prior to joining the Tata group Hindol used to lead the Asia Pacific analytics consulting practice for FICO, in India. Hindol had also worked with Citibank and TransUnion for Indian and North American markets.

Hindol had led multiple analytics consulting and customer centricity initiatives in the Indian, Asia Pacific and North American market across financial services, travel and telecommunication verticals. In India, he had been the pioneer in establishing credit bureau analytics for the Indian market; he had developed the first set of credit bureau scores for CIBIL. He had also lead analytical consulting assignments for Indian companies like HDFC Standard Life, MakeMyTrip and Airtel for evangelising the adaptation of data driven decision making.

Hindol holds a bachelor in engineering from IIT Kharagpur and an MBA from IIM Bangalore. He is also the co-author of the book titled “Business Analytics – Applications to Consumer Marketing – Sandhya Kuruganti and Hindol Basu” published by McGraw Hill India in March 2015. Hindol had partnered extensively with ISI Calcutta for developing an application focused approach for training final year students.

Joy Mustafi

joyJoy has more than twelve years of experience in industrial, research and academic world. Did graduation in Statistics (2000) from Ramakrishna Mission Residential College, Narendrapur [CU] and post-graduation in Computer Application (2003) from Regional Computer Center (RCC), Kolkata [KU]. He then got the Junior Research Fellowship award in Computer and Communication Sciences from Indian Statistical Institute (2004).

Joy joined IBM India (2006) as Analytics Consultant in the Business Analytics and Optimization service area. Engaged with IBM – India Software Lab, Watson Business Group (2013) to continue research and development in (Data Mining / Machine Learning / Natural Language Processing).

Joy invented a system, which can take mathematical question as input, then solve it automatically – in short, the machine needs to learn to think. Right at that time his son was 5 years old and just been introduced to word problems in mathematics. Joy used to teach him, observe his thinking and try to de-cypher his perception and subsequent analysis of the problem. That led to his first patent.

Moved to Global Technology Services – IT Operations Analytics as Data Scientist (2014). Also contributed as Subject Matter Expertise in IBM SPSS Statistics, IBM SPSS Modeler (Text Analytics) and IBM Content Analytics.

Joy has been Involved as visiting faculty member in different academic organizations. Having several patents, research publications on Applied Statistics and Computational Linguistics.

Nilesh Karnik

nilesh karnikNilesh is the Chief Data Scientist at Aureus. In this role, he is responsible for development of algorithms and mathematical models that help large organizations with advanced analytics solutions.

Nilesh has a Doctorate in Electrical Engineering from University of Southern California (1998). His Ph.D dissertation made a substantial contribution to the theory of Type-2 Fuzzy Logic Systems and his work is still widely referenced. Nilesh is passionate about analytics and is conversant with a wide range of qualitative and quantitative techniques.

Prior to joining Aureus, Nilesh was with Morgan Stanley Advantage Services where he held a variety of roles with analytics and technology teams. Other organizations he has worked with in the past include Tata Infotech, GE Capital International Services and MindTree Consulting.

Nilesh lives in Mumbai with his wife and two daughters.

Praphul Chandra

praphulPraphul Chandra is a Principal Data Scientist at Hewlett Packard Enterprise. He focuses on the application of machine learning techniques to streaming and sensor data. This data science domain at the intersection of Big Data and Internet of Things poses some unique challenges: some algorithmic (incremental learning) and some computational (In-database vs. In-memory vs. streaming). His broad experience across machine learning, embedded systems and human computer interaction enables him to lead an inter-disciplinary teams of statisticians, computer scientists and domain experts to deliver data science projects.

Besides contributing to projects, Praphul regularly publishes in international conferences advancing the state of art. To build the data science community in India, he continues to deliver tutorials and invited talks in technical conferences & industry forums. He holds 10 patents and has 12 patent pending filings.

Prior to his current role, Praphul was the principal investigator for the Crowd-Cloud project at HP Labs which sought to combine machine learning & crowdsourcing to create scalable solutions. His research interests are Game Theory, Machine Learning, Complex Networks & Public Policy. He holds a B. Tech in Electronics Engineering (IIT-BHU), M.S. in Electrical Engineering (Columbia University, NY), PG Diploma in Public Policy (Univ. of London) and is currently working on his PhD in Mechanism Design (IISc-Bangalore.)

Prashant Warier

prashant wariorPrashant has over 14 years of experience in data science and artificial intelligence. He is an expert in the fields of context aware digital advertising, hyper-personalized marketing, merchandise planning, and network optimization. He has authored a book and several papers and patents in AI and related fields.

He founded Imagna Analytics in 2012, a personalized targeting platform that decodes customer behavior and delivers contextually relevant digital ads and offers in real-time. This AI startup was recently acquired by Fractal Analytics.

In an earlier stint with Fractal, Prashant was responsible for laying the foundation of their Customer Genomics platform. He also was part of the founding team of the SAP Data Science practice.

Rajeev Rastogi

rajeevRajeev Rastogi is the Director of Machine Learning at Amazon where he directs the development of machine learning platforms and applications such as product classification, product recommendations, customer targeting, and deals ranking. Previously, he was the Vice President of Yahoo! Labs in Bangalore where he was responsible for research programs impacting Yahoo!’s web search and online advertising products. He was named a Bell Labs Fellow in 2003 for his contributions to Lucent’s networking products while he was at Bell Labs Research in Murray Hill, New Jersey (1993-2004). He launched and led two premier research labs in India: Bell Labs (2004-2008) and Yahoo! Labs (2008-2012). Rajeev received his B. Tech degree from IIT Bombay, and a PhD degree in Computer Science from the University of Texas, Austin.

Rajeev was named an ACM Fellow in 2012 for his contributions to large-scale data analysis and management. He has published over 100 papers in top-tier international conferences (such as SIGMOD, VLDB, SIGKDD) and 33 papers in international journals (such as TKDE and VLDB Journal). According to Google Scholar, his research publications have over 12,500 citations and an h-index value of 57. Rajeev has also been a prolific inventor with 57 issued US Patents. He is currently a member of the News editorial board of the CACM, and was previously an Associate editor for TKDE. He has served on over 50 program committees of the leading database and data mining conferences, and was a Program Co-chair for the CIKM conference in 2013 and the ICDM conference in 2005.

Satnam Singh

satnamA data geek, researcher, business and team builder, Satnam has a decade of work experience in successfully building data products from concept to production. As a data scientist and team leader in Samsung Research India Bangalore, he built data science team and developed several analytics features in smartphone.

Prior to Samsung, he spent nearly five years at General Motors Research as a senior researcher, with responsibility for conceptualizing and developing data products from scratch for several verticals in GM. After working in CA Technologies for about 1.5 years, Satnam is currently working in a startup as a Principal Data Scientist where he is building a data science product.

Apart from holding a PhD degree in ECE from University of Connecticut, Satnam also holds a Masters in ECE from University of Wyoming and BE from IIT Roorkee. To his credit, he has 7 granted patents, 13 patent applications and 32 journal and conference publications. Satnam is a senior IEEE member and a regular speaker in various Big Data and Data Science conferences.

Besides work, Satnam is an avid cyclist, marathon runner and rock climber. He also participates in several adventure events in a year.

Shailesh Kumar

shaileshDr. Shailesh Kumar is currently Chief Scientist and Co-Founder of a Stealth mode AI startup. He also serves as a faculty of Machine Learning at statistics.com, IIIT-Hyderabad, and ISB-Hyderabad.

Dr. Kumar’s research interests are in fundamental problems in AI and ML especially in natural language understanding, computer vision, and reasoning and bridging the gap between the reality and the dream of AI of building truly intelligent “Thinking Machines”!

Prior to his own startup, Dr. Kumar was part of the Machine Intelligence group at Google, Inc. for five years where he worked on a wide variety of problems including Phrase Discovery, Word Sense Disambiguation, Conversation Modelling, E-Discovery, Knowledge Extraction, Enterprise Search, Machine Learning, and Computer Vision. Dr. Kumar holds 6 US patents with Google, Inc. and 5 publications while at Google.

Prior to Google, Dr. Kumar worked as Sr. Scientist at Yahoo! Labs for about 2 years primarily on Image Search and Query understanding problems. His team received the Yahoo! Superstar award for improving Yahoo! image search quality by more than 10%.

Prior to Yahoo!, Dr. Kumar worked as a Principal Scientist at Fair Isaac Research for about 8 years where he worked on credit card fraud detection, credit modelling, text analytics, computer vision, and retail data mining problems. Dr. Kumar holds 8 US patents with Fair Isaac.

Dr. Kumar received his Masters in Computer Science (Artificial Intelligence and Machine Learning) and PhD in Computer Engineering (Statistical Pattern Recognition) both from University of Texas at Austin, USA. He received his B.Tech in Computer Science and Engineering from IIT-Varanasi in 1995.

(Visited 21,462 times, 37 visits today)

The post Top 10 data Scientists in India – 2015 appeared first on Analytics India Magazine.

Top 10 Analytics Trends in 2015

$
0
0

trendsAs we get ready to bid goodbye to 2015 and gear up to welcome another year, we can’t help but retrospect on how this year turned out to be for the analytical space and what to expect in the future. However, to plan the future it is important to look at the past, and for that matter one needs to compare. Hence, we bring you a mixed palette which makes it interesting to see how different last year analytical trends were from this year as well as what new trends may stem from these.

Analytics India Magazine decided to dig out the best and most popular analytical trends by speaking to those who have experienced the eye of analytics hurricane and continue to win over it diligently. Here’s a glimpse as the data leaders from different companies share the top and emerging trends that rule analytical the industry.

1. Increased use of Digital Marketing and Social Media Analytics

Screen Shot 2015-12-01 at 12.08.43 PMSuhale Kapoor (Executive Vice President and Co-Founder, Absolutdata Research & Analytics Pvt. Ltd), observed a growth in social media analytics and business intelligence through digital marketing. He remarked that digital marketing analytics expenses had increased by 60% in 2015 as branding and advertising businesses boomed.

Likewise, he predicts that social media and online advertising on mobile will continue to grow as integration of offline and online customer experience is on the rise.

“There is a rise in democratizing analytics through cloud and social media”, agreed Sudipta Sen (Regional Director – South East Asia, Vice Chairman and Board Member – SAS Institute (India) Pvt. Ltd.) He added that, cloud helps in making analytics available to more consumers at lower cost. In fact, businesses today derive meaningful insights from social media using the flood of conversations. By turning towards analytics to help them understand customer attitudes and identify trends, they make smarter marketing decisions.

2. Governed data discovery becomes essential

James Richardson [B2L] - 072James Richardson (Business Analytics Strategist at Qlik), talks about another emerging trend – Self-service Business Intelligence.

With more data out there, users want to become more self-sufficient in creating their own analyses rather than relying on others, but this means they need to work in a managed data space. Within a framework of governance, users will focus their energy on getting insights from their analyses.

With the ability to combine both internal and external data sources, users now have access to more context around their data, which ultimately leads to more insights and better decisions.

Meanwhile, Lavanya Uppala (Practice Head of Big Data Analytics program at Bosch India), spoke about creating a unified data culture across organizations. Thereby, enabling a variety of analytical applications such as customer experience management, social media monitoring etc.

3. Personalization

s sen2Sudipta Sen (Regional Director – South East Asia, Vice Chairman and Board Member – SAS Institute (India) Pvt. Ltd.) identified ‘Personalization’ as an emerging trend. Owing to the advancements in technologies combined with the avalanche of data available today, enterprises across industries are leveraging inexpensive technologies such as Hadoop to analyze huge amounts of customer data, understand patterns and subsequently personalize their offers to their customers. This in turn helps them out-think and out-do the competition.

James Richardson gives us another angle as he believes “More data storytelling equals more engagement”. In fact, when making a proposal to a group, 86 percent almost always or often take time to ‘lay out what has happened previously,’ and 80 percent almost always or often take time to ‘project forward or to predict possible outcomes’.”

He added that storytelling not only personalizes the task at hand, but it can also make it more memorable, impactful, and relevant for those that hear it. In 2016, there will no longer be an excuse to “take that offline.” People will use interactive storytelling to deliver information in a more compelling way that prompts them to take action in the moment, when the insight emerges.
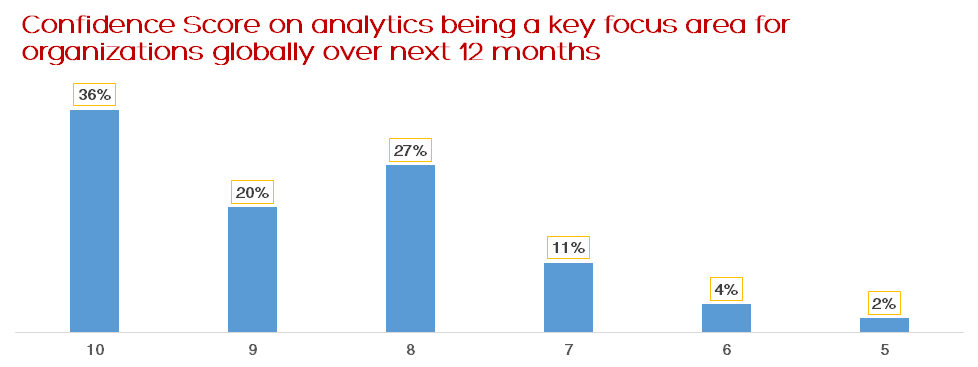
4. Expansion Analytics for Internet of Things (IoT)

This steers us to our next topic – IoT. Now, most of our experts percept that 2015 is witnessing an expansion of the ‘Internet of things’ or the IoT at high rate. Sudipta Sen, said that “More devices than ever before are being connected to the internet today. In fact with over 30 billion devices forecasted to be connected to the internet by 2020, we truly live in an age of Internet of Things (IoT).”

IoT is the concept of everyday objects – from industrial machines to wearable devices, using built-in sensors to gather data and take action on it across a network. To boot, governments and organizations alike are exploring ways to leverage the vast volumes of data generated by these devices and platforms to optimize processes, create differentiated offerings and derive new revenue streams.

rachitMoreover, Rachit Ahuja (Head of Global Marketing, Ma Foi Analytics) contributed by stating that Indian analytics market space now has start-ups providing Internet of Things (IoT), machine learning and NLP based products that can crunch an entire set of big data and use algorithms to come up with accurate and tailored results. He predicts that “this is one of the interesting trends that will catch up in days to come!”

5. Analytics in Education industry: sprouting through MOOCs

Another interesting trend that has been sprouting steadily was spotted by Sray Agarwal (subject matter expert of Business Analytics for TimesPro) and Lavanya Uppala. They agree that universities have started setting up data science and analytics courses as the demand in the industry has increased.

Profile Pic- Sray AgarwalSray Agarwal remarked that Massive Open Online Courses a.k.a MOOCs are not a new concept for students and professionals. Numerous foreign universities and institutions have launched MOOCs across varied subjects from mathematics to data science. However, in the world of analytics, MOOCs have really changed the way people learn data science. Today, they are not merely recorded videos of professors/trainers talking about data science, but they also uniquely connect with resources such as blogs, groups, discussion boards and forums. They also help hosting meet-ups for the participant for enhanced learning experience.

On the other side, these MOOCs are leveraging the data collected through the participant to improve the content, quality and scope of the delivery. Needless to say, analytics is transforming every business and taking them to greater heights than ever before.

Furthermore, Lavanya explained that even in India, “Many top B-schools and Universities are setting up data science and self-service data discovery courses into their academic curriculum to meet the increasing demands from the industry to produce quality talent pool.”

6. Data Visualization

Moreover, James Richardson remarked that rather than just consuming information, users are now engaging in data prep and profiling. As a result, visualization is now becoming a form of self-expression.

By creating visual apps, users are expressing their views and learning about themselves through being actively engaged with the growing volumes of data. You can see this trend in the rise of the quantified-self movement at an individual level and data-driven journalism in the mass media, altering how people are using public data to understand how society works.

7. Cognitive analytics continuing to drive users

Lavanya_UppalaMs. Lavanya (Practice Head of Big Data Analytics program at Bosch India) pointed out that context-aware cognitive analytics along with its underlying AI and NLP techniques are enhancing the robustness and accuracy to solve complicated business problems without constant human observation.

Therefore, significant developments in cognitive computing can improve the quality of the decisions made for the business users.

Furthermore, Rachit Ahuja contributed to the discussion by claiming that “Consumers will expect their software to anticipate their needs, driving requirements for predictive capabilities in all apps.

Thus, the goal is to expand the boundaries and our understanding of what it means to assemble and display intelligence ‘in context’. Clients are now looking for embedded predictive analytics with visualization capabilities rather than a separate visualization tool on the backend.

8. Product based analytics

Rachit Ahuja affirms that product based analytics consumption is definitely on the rise. People and departments are increasingly lining up to self-service analytics software — which are easy to use and do not require any technical knowhow.

Conversely, there is a growing shift from project based to outcome based engagement model. Interest in new methodologies, involving semi-structured and unstructured data, e.g. NLP, elastic search and machine learning will see significant rise.

9. Mobility – A screen in the hand is worth two on the desk.

James Richardson, said that Mobility is becoming more important than ever for data users. This means that enabling multi-device lensing of BI and analytics will gain importance. For instance, 85 percent of respondents from the U.S. and 77 percent of respondents from the rest of the world complete their objectives by using multiple devices simultaneously. Having unlimited access to their data can help users ask “why?” any time, and find the answer quickly. BI and visualization solutions that don’t support users moving from device to device, often and at speed, will not deliver the kinds of experience that people want.

10. Predictive analytics in entertainment industry

As we reached the last part of our discussion, Vibha Bhilawadikar (Vice president, Kiesquare) and Sray Agarwal also spoke about predictive analytics in entertainment industry.

Sray Agarwal expressed that previously analytics was utilised only for business purpose and for conventional decision making. However, there has been a paradigm shift in that notion. Based on various attributes that can either be aggregated in-house or through social media, lot of insight on revenue, ratings, audience sizes, movie attendance, number of prints, pre and post release marketing campaigns and even probability of grabbing awards can be revealed using predictive analytics.

However, Vibha Bhilawadikar argued that “while there can be set frameworks with specific protocols, we have to lace all the quantitative analytics with qualitative conversations and pitches to achieve the planned business outcomes.” She strongly believes, from her personal experiences of the same industry, that the business situations that we encounter cannot be negotiated with prescriptive solutioning in its complete totality. So while descriptive analytics is needed for the context of business thinking, predictive analytics is needed for building “what if” scenarios. Therefore, companies have to layer qualitative research in their strategy to accomplish their planned business goals.

Thus, it is interesting to note that Analytics has touched upon all sorts of spheres this year, from education industry to entertainment, it has not restricted to any one sector. We conclude by hoping this compilation would help you reflect on what new trends would stem in 2016 and be better prepared to welcome another new year!

(Visited 1,007 times, 7 visits today)

The post Top 10 Analytics Trends in 2015 appeared first on Analytics India Magazine.

Viewing all 435 articles
Browse latest View live